Blood Drives Report
AI-Augmented Analytics Platform for Blood Drive Fundraising Operations

Business context and structural constraints
ARC's blood drive program spans thousands of annual events, each with its own sponsor relationship, historical yield, donor geography, and logistical profile. The organization needed a way to rank and prioritize opportunities — but the inputs to that ranking came from disparate systems across Azure and AWS environments, and the analysis model needed to be nuanced: not just total units collected, but weighted factors including sponsor engagement history, regional demand, time-since-last-drive, and event type. On top of the analytical challenge was a synchronization challenge: keeping Azure-sourced operational data and AWS-sourced analytical outputs consistent without manual reconciliation, while preventing write conflicts when multiple analysts or data sources updated the same models concurrently.
Cross-cloud synchronization without data drift
ARC's infrastructure spans Azure (operational data) and AWS (analytical processing). Keeping these in sync without a shared data plane required building idempotent synchronization jobs with explicit conflict detection — any row that changes in Azure must produce a deterministic, verifiable outcome in the AWS-hosted analytical model, regardless of network conditions or timing.
Making the scoring model configurable without rebuilding it
The scoring model needed to be adjustable by ARC's operations team — not hardcoded by engineers. We built a parameter management interface that lets analysts adjust factor weights and run retrospective scoring against historical drive data to validate changes before applying them to live prioritization.
The Solution
Architectural approach and implementation
Blood drives don't run on gut feel — they run on sponsor relationships, historical donor patterns, and collection site capacity. But when that data lives across Azure Services, AWS infrastructure, and multiple operational reporting systems, extracting useful insight requires analysts to manually aggregate and reconcile before any strategic decision can be made. At the scale ARC operates, that delay has a real cost in missed fundraising opportunities. Blood Drives Report is an analytical ecosystem built to change that. The platform ingests blood drive performance data across the US, applies a weighted scoring model to rank fundraising opportunities by likely impact, and uses AWS Bedrock to generate AI-written summaries and strategic recommendations — replacing hours of manual analysis with actionable intelligence available on demand. Operational since September 2025, the platform gives ARC's fundraising and operations teams the analytical depth to prioritize where to invest effort across their national drive calendar, with cross-cloud data synchronization ensuring numbers are always current.
How we turned the challenge into a solution
Each stage formalizes uncertainty into a concrete engineering outcome
Audit → Dependency Map
Inventory of 17+ disparate systems, data flow mapping, identification of critical integration points and performance bottlenecks
Map → Unified Architecture
Design of event-driven microservice architecture with multi-region data residency and zero-trust security model
Architecture → Working Prototype
Document management MVP with FIDO2 authentication, AES-256 encryption, and basic workflow engine for pilot group
Prototype → Scalable Platform
Horizontal scaling to 160+ countries, multi-tenant isolation, AI document classification with 95% accuracy
Platform → Analytics Core
MyInsights recommendation engine, predictive SLA alerts, personalized delivery of regulatory updates
Core → Continuous Compliance
Automated retention policies for 160+ jurisdictions, document integrity chain, one-click audit report generation
Weighted Opportunity Scoring Engine
The analytical core evaluates each blood drive opportunity across a configurable set of weighted parameters: historical yield, sponsor engagement frequency, regional demand index, collection site capacity, and recency of last event at a location. Output is a ranked list of opportunities — not sorted by raw volume, but by expected return on organizational investment. Analysts can adjust parameter weights and run retrospective scoring against historical data to validate model changes before applying them to live prioritization.
AI-Assisted Analysis via AWS Bedrock
AWS Bedrock processes the structured outputs of the scoring engine and generates natural-language summaries for each prioritized opportunity: why the model ranked it, what the historical context is, and what engagement approach is recommended. Analysts receive ready-to-use narratives rather than raw data tables.
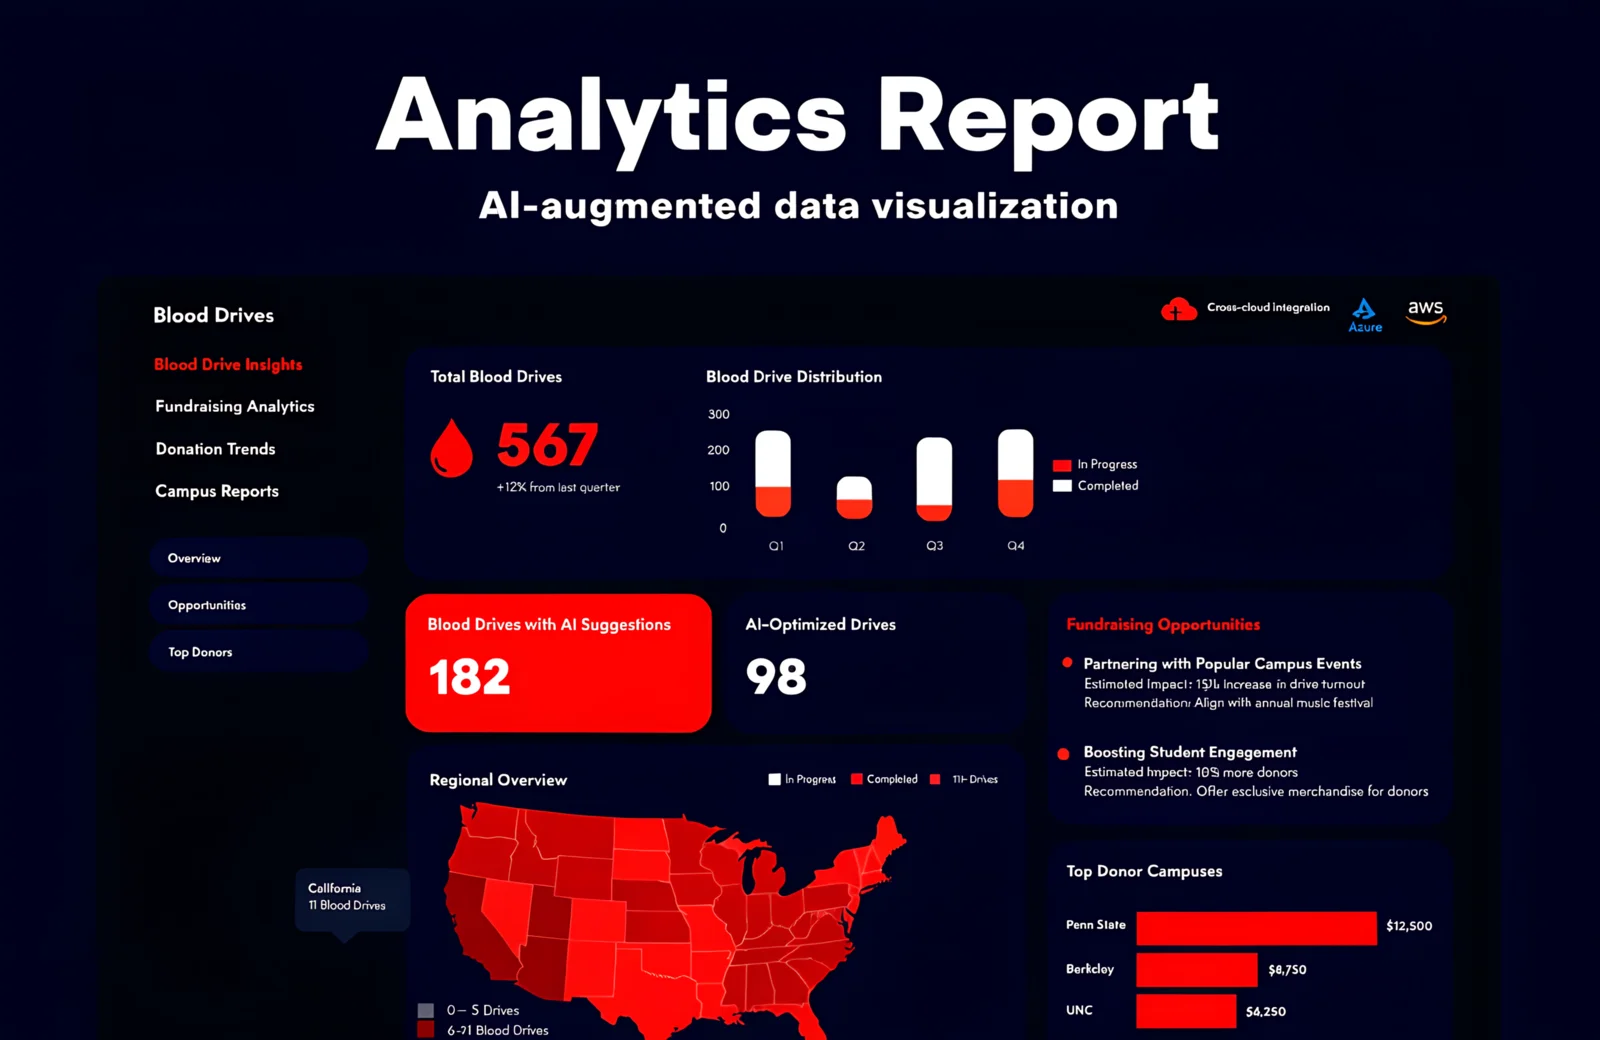
SvelteKit KPI Dashboards
Interactive analytics dashboards built in SvelteKit provide real-time visibility into blood drive performance at national, regional, and individual event levels. Drill-down navigation moves from aggregate KPIs to individual drive records with full historical context — designed for the planning cadence of fundraising and operations leadership.
Cross-Cloud Data Synchronization
Automated pipelines synchronize operational data from Azure Services with analytical models running on AWS infrastructure. Synchronization jobs are idempotent and logged — any failure surfaces immediately with enough context for manual resolution without data loss or silent drift between environments.
Concurrency-Controlled Data Processing
The NestJS backend manages concurrent updates from multiple data sources and analysts through explicit concurrency controls at the processing layer. Write conflicts on shared analytical models are resolved via optimistic locking — preventing the silent data corruption that occurs when multiple sources update the same weighted model simultaneously.
The Impact
Quantitative results demonstrating the real impact of implementation on operational efficiency, infrastructure reliability, and platform scalability
35% more high-impact fundraising opportunities identified per planning cycle through weighted analysis versus prior ranking methods
Reporting preparation time cut by 50% — AWS Bedrock-generated summaries replace manual analyst writeups
Data processing throughput improved by 40% through NestJS concurrency controls on the analytical pipeline
KPI-based decision cycles accelerated by 45% — SvelteKit dashboards deliver drill-down from national overview to individual drive in under 3 clicks
100% data integrity maintained across Azure and AWS infrastructure through synchronized idempotent pipelines
Technology Stack
Built with proven enterprise-grade technologies
Visual Journey
Screenshots and mockups from the project
Interested in a similar solution?
Discuss your project→