
OpportunityIQ
Blood-drive priorities backed by sponsor data and scoring rules.
An analytical workspace for American Red Cross fundraising and operations teams. OpportunityIQ, previously Blood Drives Report, connects upcoming drives, sponsor relationships, weighted scores and AI-assisted summaries to help teams prepare their outreach.
A planning workspace with explainable priorities.
Event and sponsor records
The workspace combines event dates, locations and status with sponsor relationships and historical activity. Search and filters help planners work with a relevant region, industry or time window.
Weighted scoring with visible rules
Weighted scoring produces a common scale for comparing drives. An in-product guide explains the five priority levels, contributing factors and the special rule for media drives, so the ranking can be reviewed alongside the event.
AI summaries and analyst feedback
Bedrock-assisted summaries sit beside the data they describe. The analysis date, agreement controls and written feedback let reviewers assess the recommendation and record what it missed.
Data exchange between Azure and AWS
The implementation connects Azure reporting inputs with AWS analytical services. NestJS handles processing and concurrent updates, supplying the SvelteKit workspace with the records used for scoring and review.
A shortlist built around region, date and sponsor relationships.
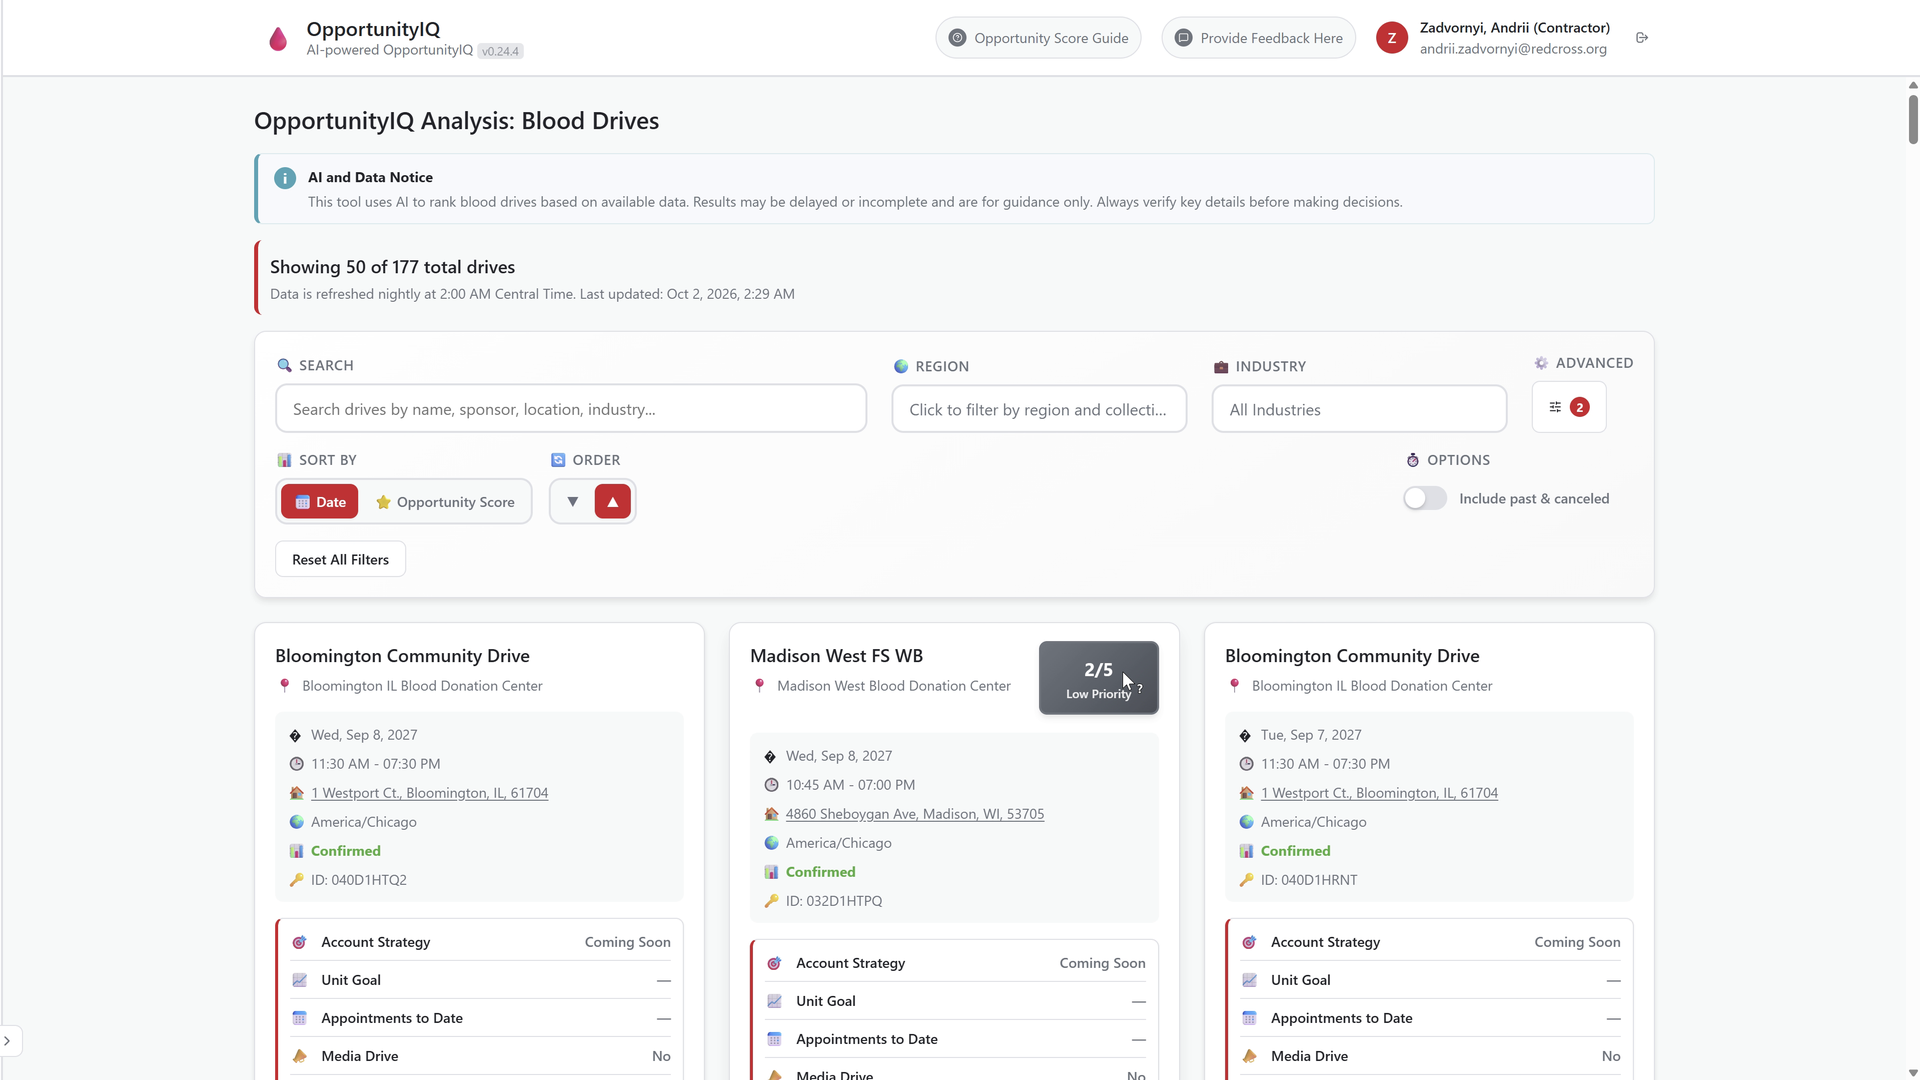
Opportunity discovery
The main view places name, sponsor and location search above the drive cards. Region and industry selections narrow the results, while date or opportunity-score sorting changes their order. Each card retains event details and available sponsor signals, keeping the comparison grounded in a specific drive.
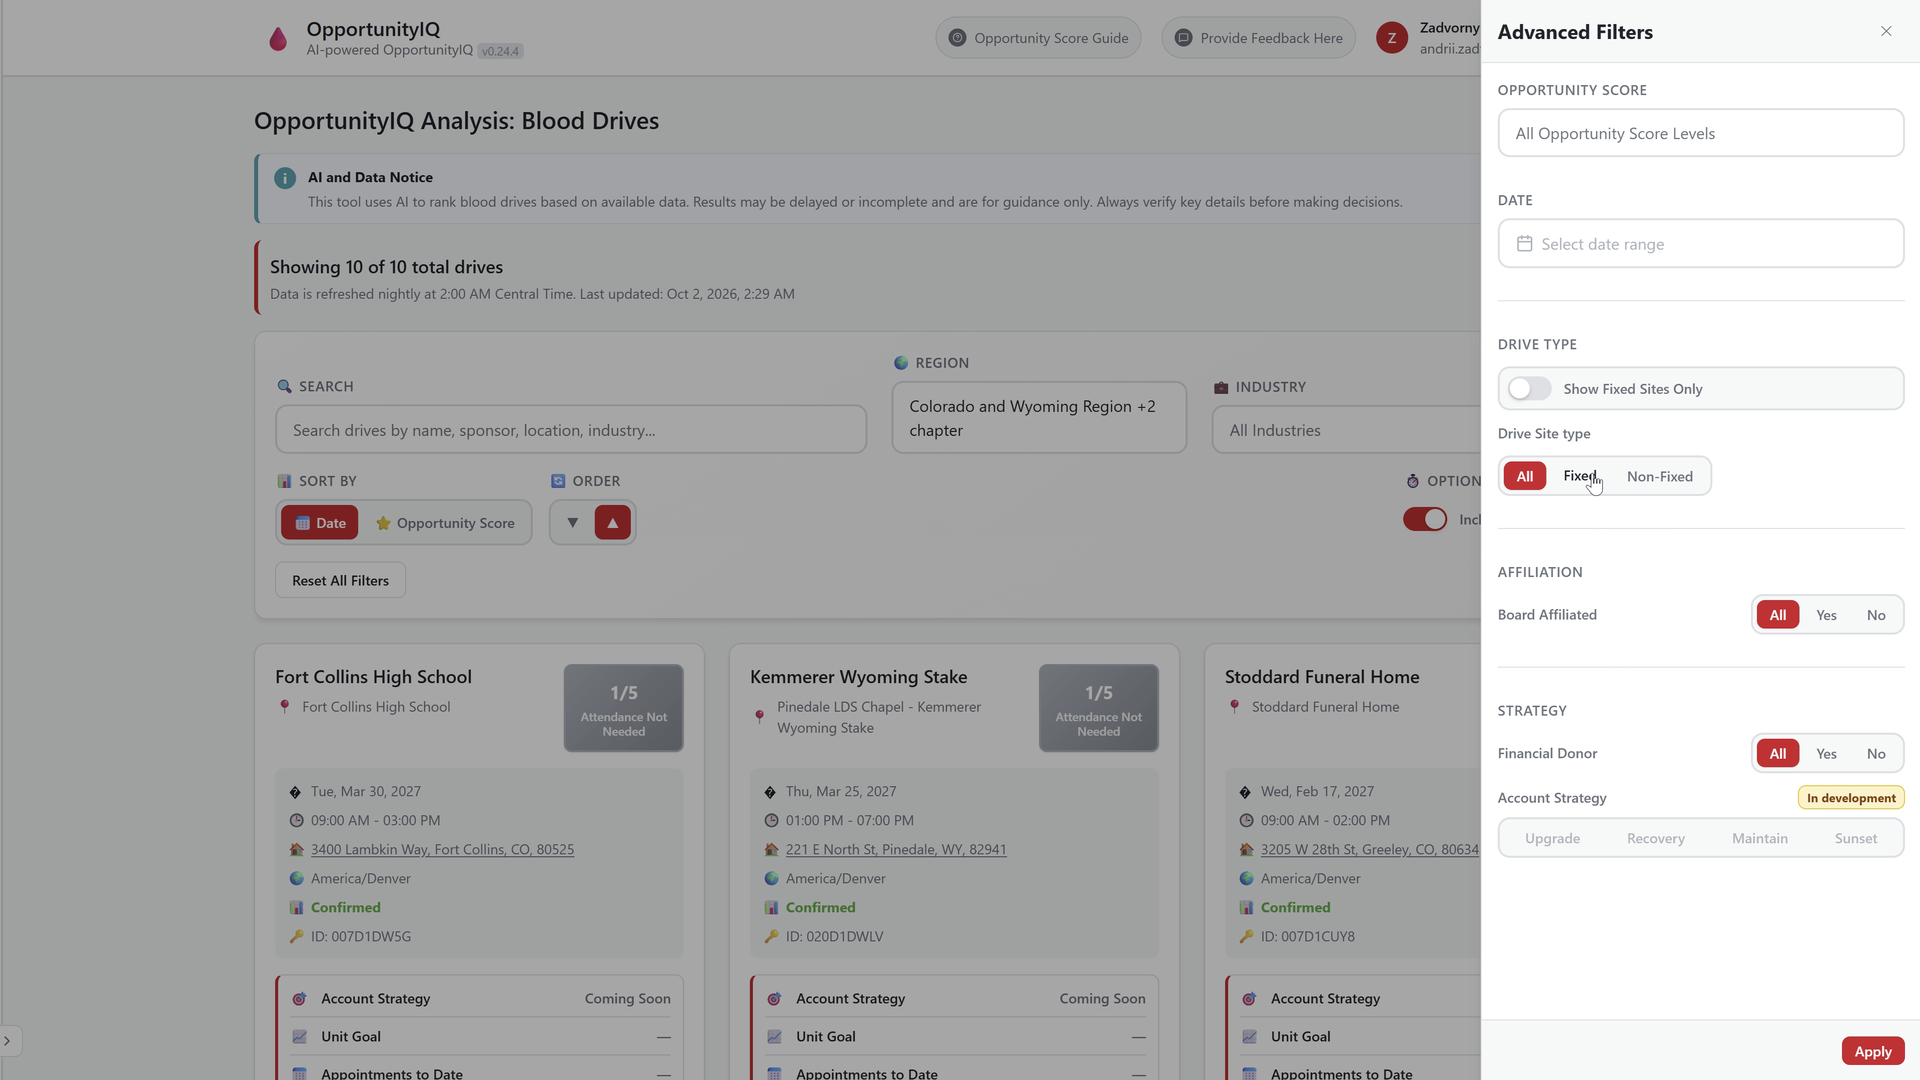
Advanced planning filters
The advanced panel adds score levels, a date range, fixed-site options and affiliation criteria. Board affiliation and financial-donor status can be included in the selection, with an Apply action to update the list. The catalogue remains visible while the planner sets the conditions.
Every priority level has an explicit scoring rule.
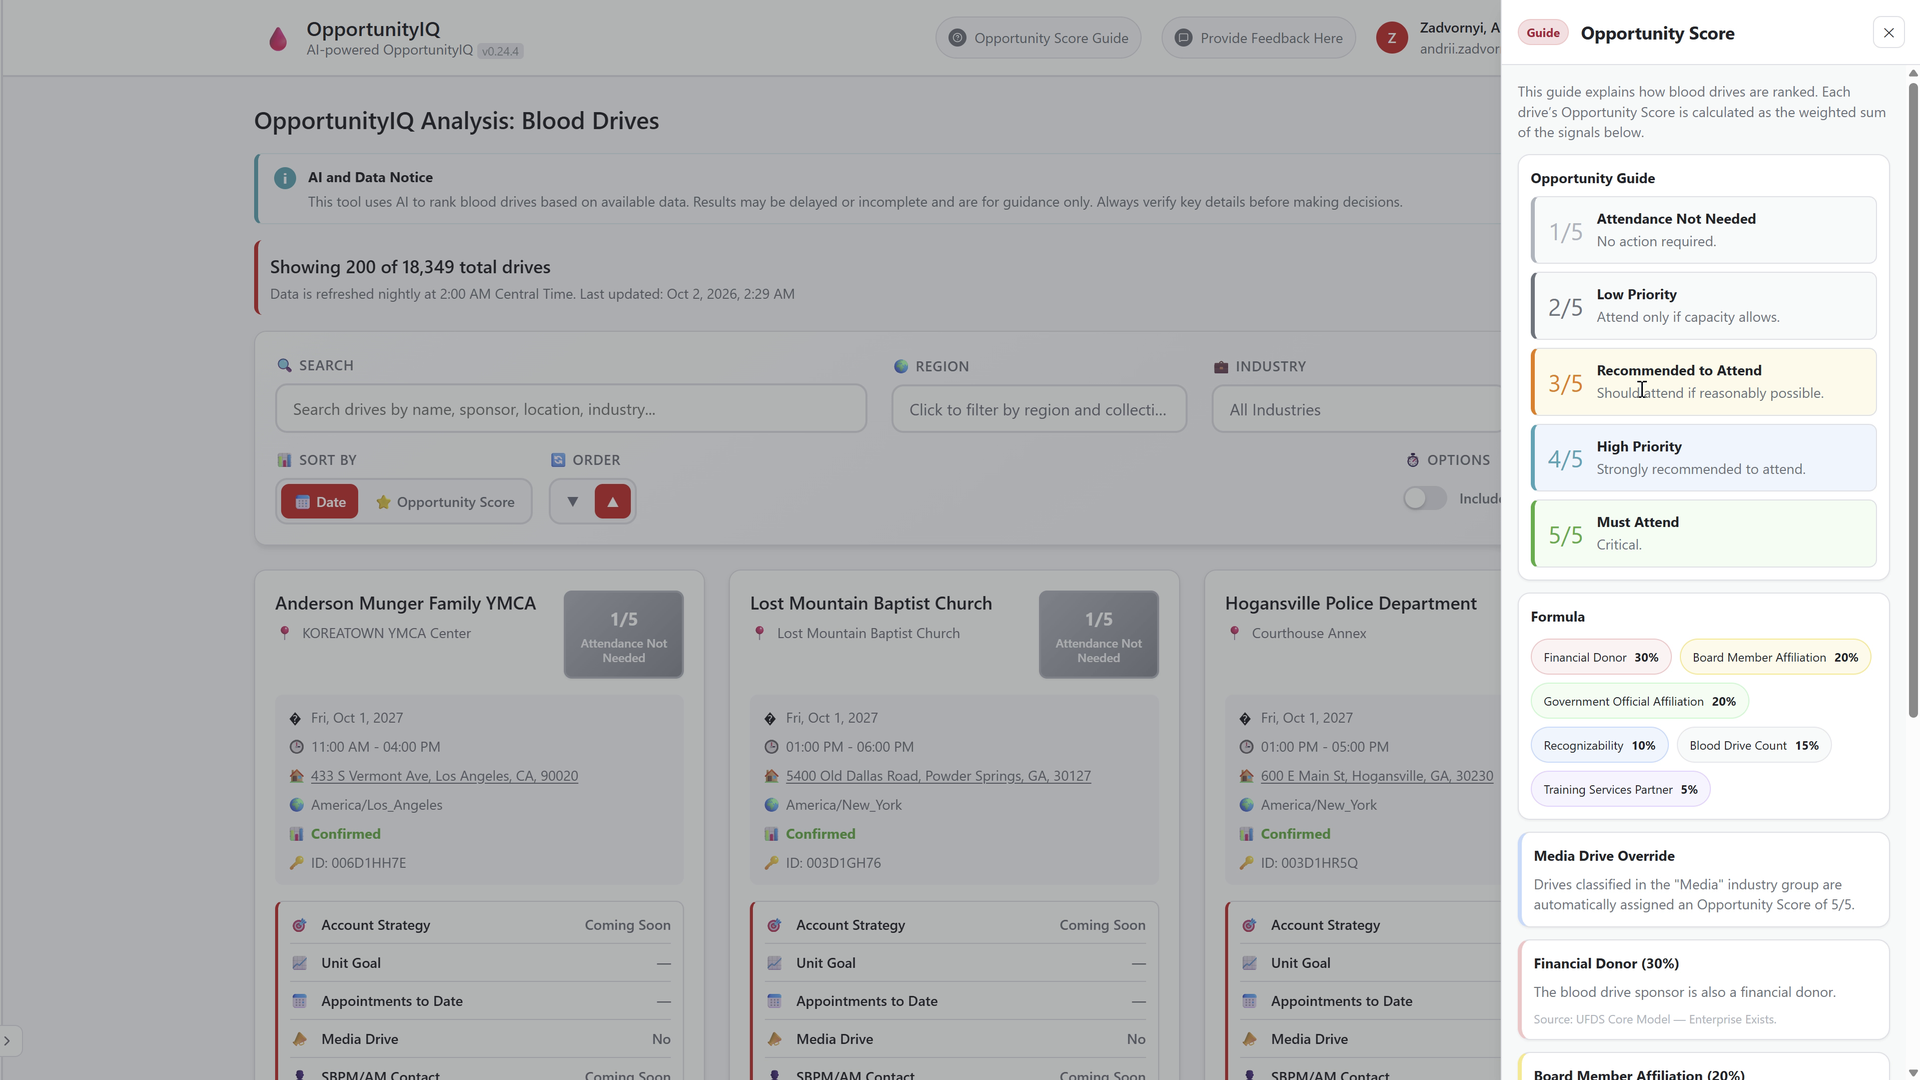
Priority levels and contributing factors
The guide opens beside the list and defines five levels, from attendance not needed to must attend. It names the weighted factors, including financial-donor status, affiliations, recognisability and drive history. A media-drive override is shown separately, making this exception visible instead of hiding it inside the score.
AI explanations sit beside the facts used to assess the drive.
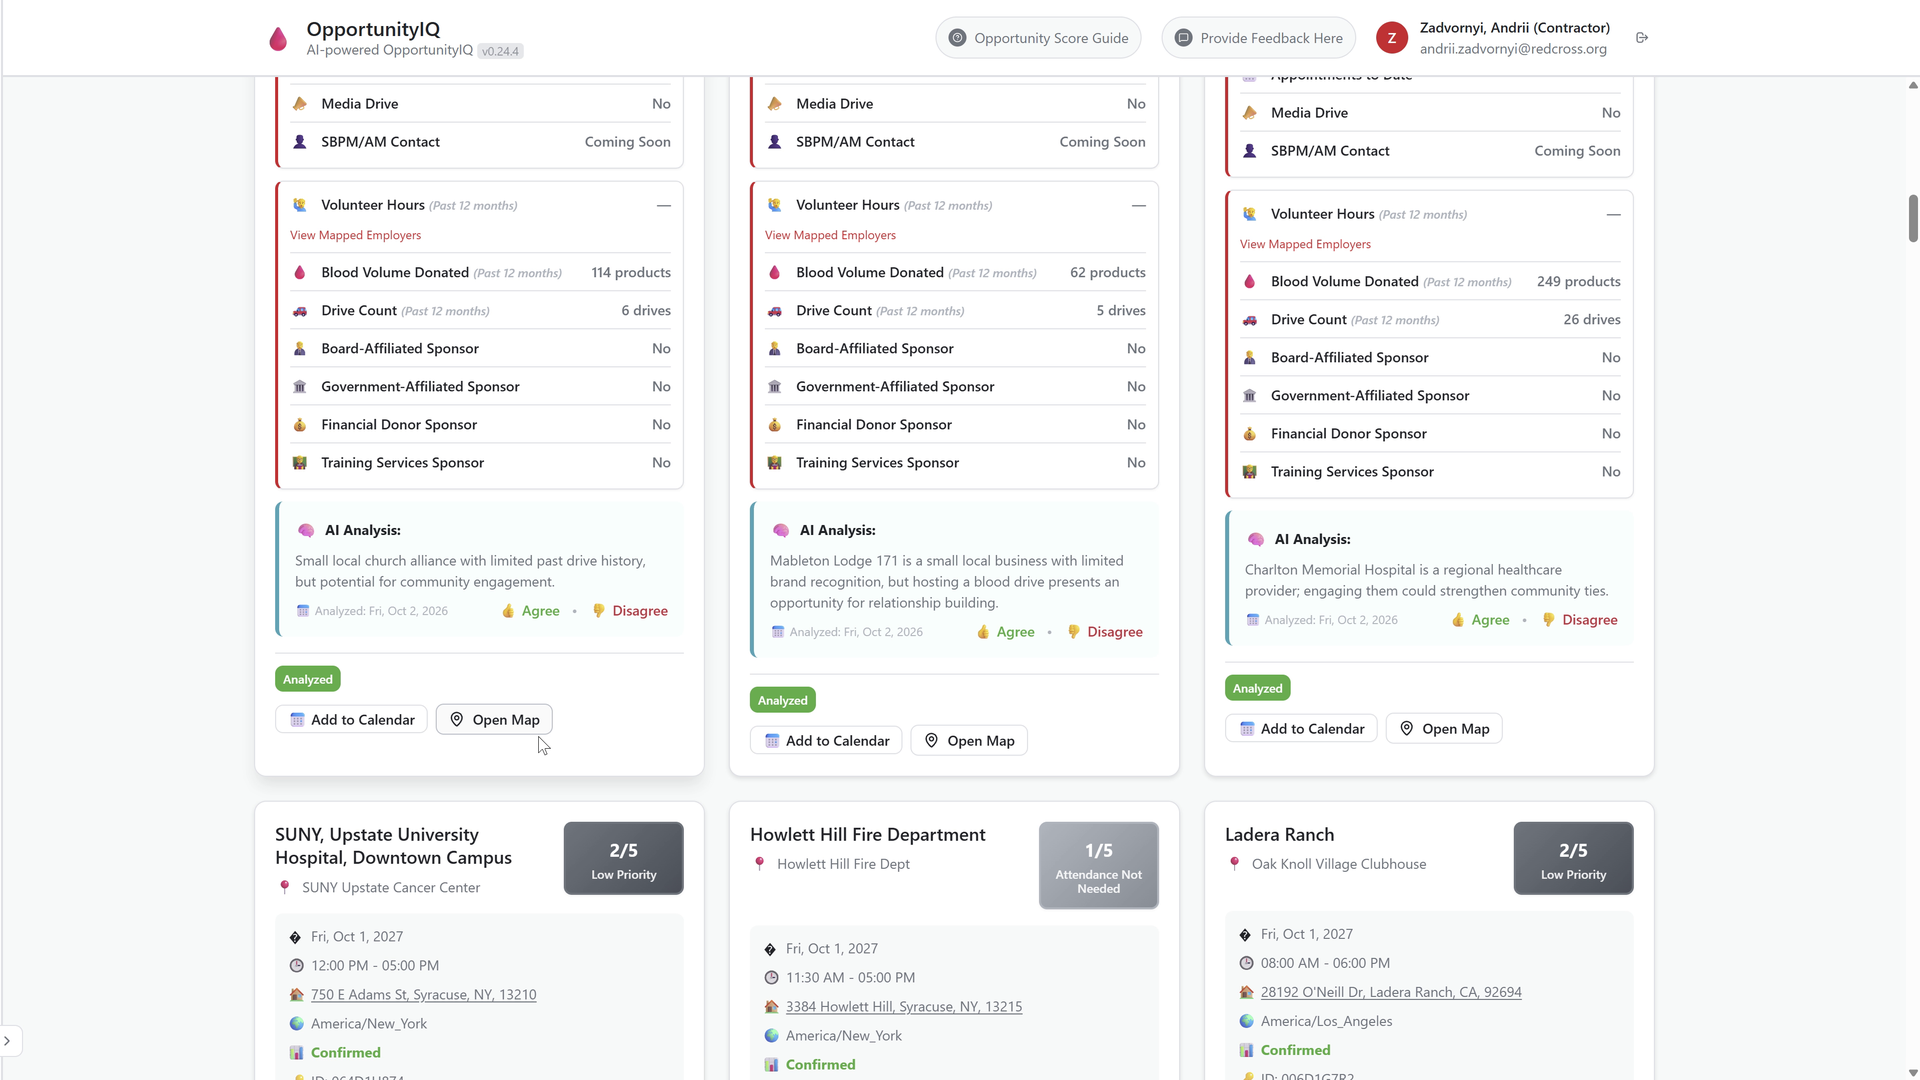
The assessment and its supporting data
Drive cards list historical activity and sponsor attributes above the AI analysis. The summary carries an analysis date and Agree / Disagree actions, while calendar and map links support the next planning step. Structured facts and generated wording remain distinct parts of the card, so the reviewer can compare them before acting.
Analyst feedback records what the recommendation missed.
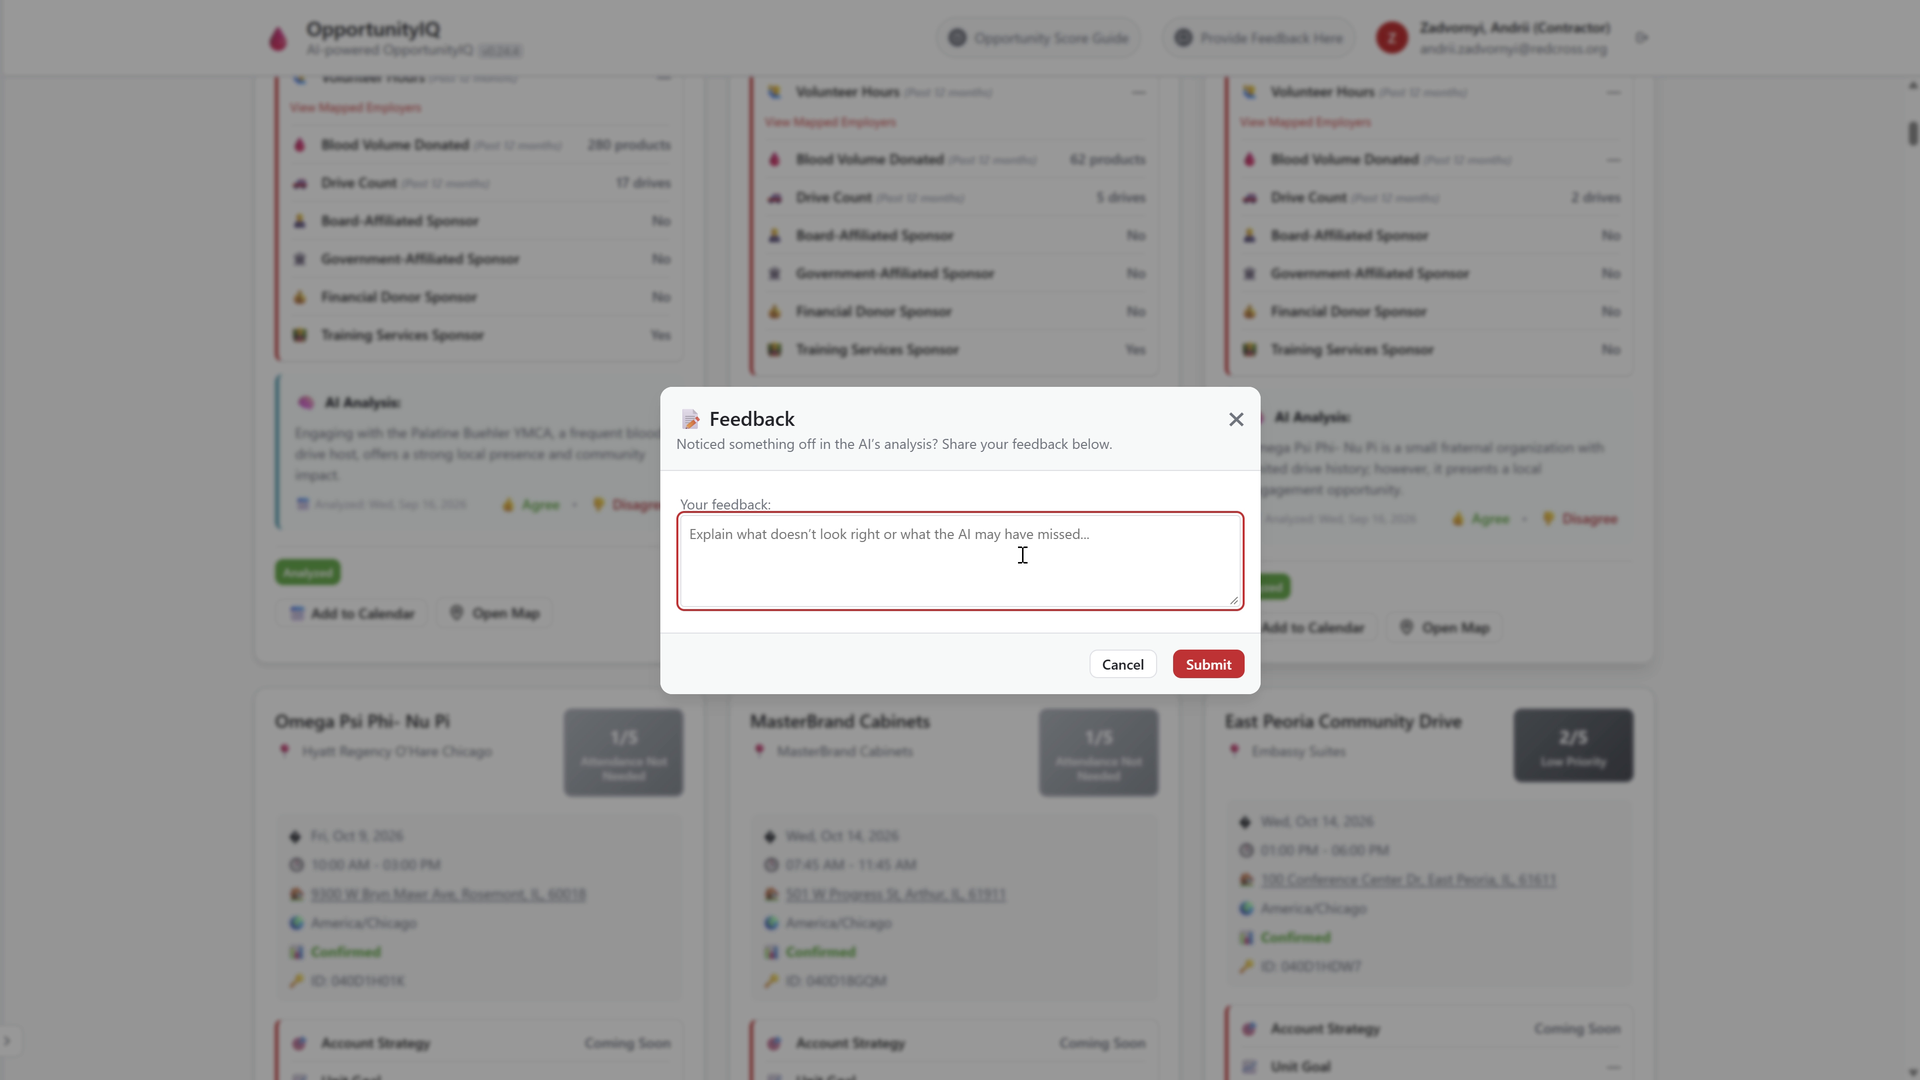
Feedback on a recommendation
Disagree opens a feedback dialog over the opportunity list. The reviewer can describe which information the analysis missed or interpreted incorrectly, then submit or cancel. This records the substance of the objection, giving the team more useful feedback than a negative reaction alone.
The reporting foundation behind OpportunityIQ.
These earlier Blood Drives Report screens show the original analysis list and individual insight cards. They preserve the same working context: event details, available history, an explicit score and the analyst’s response.
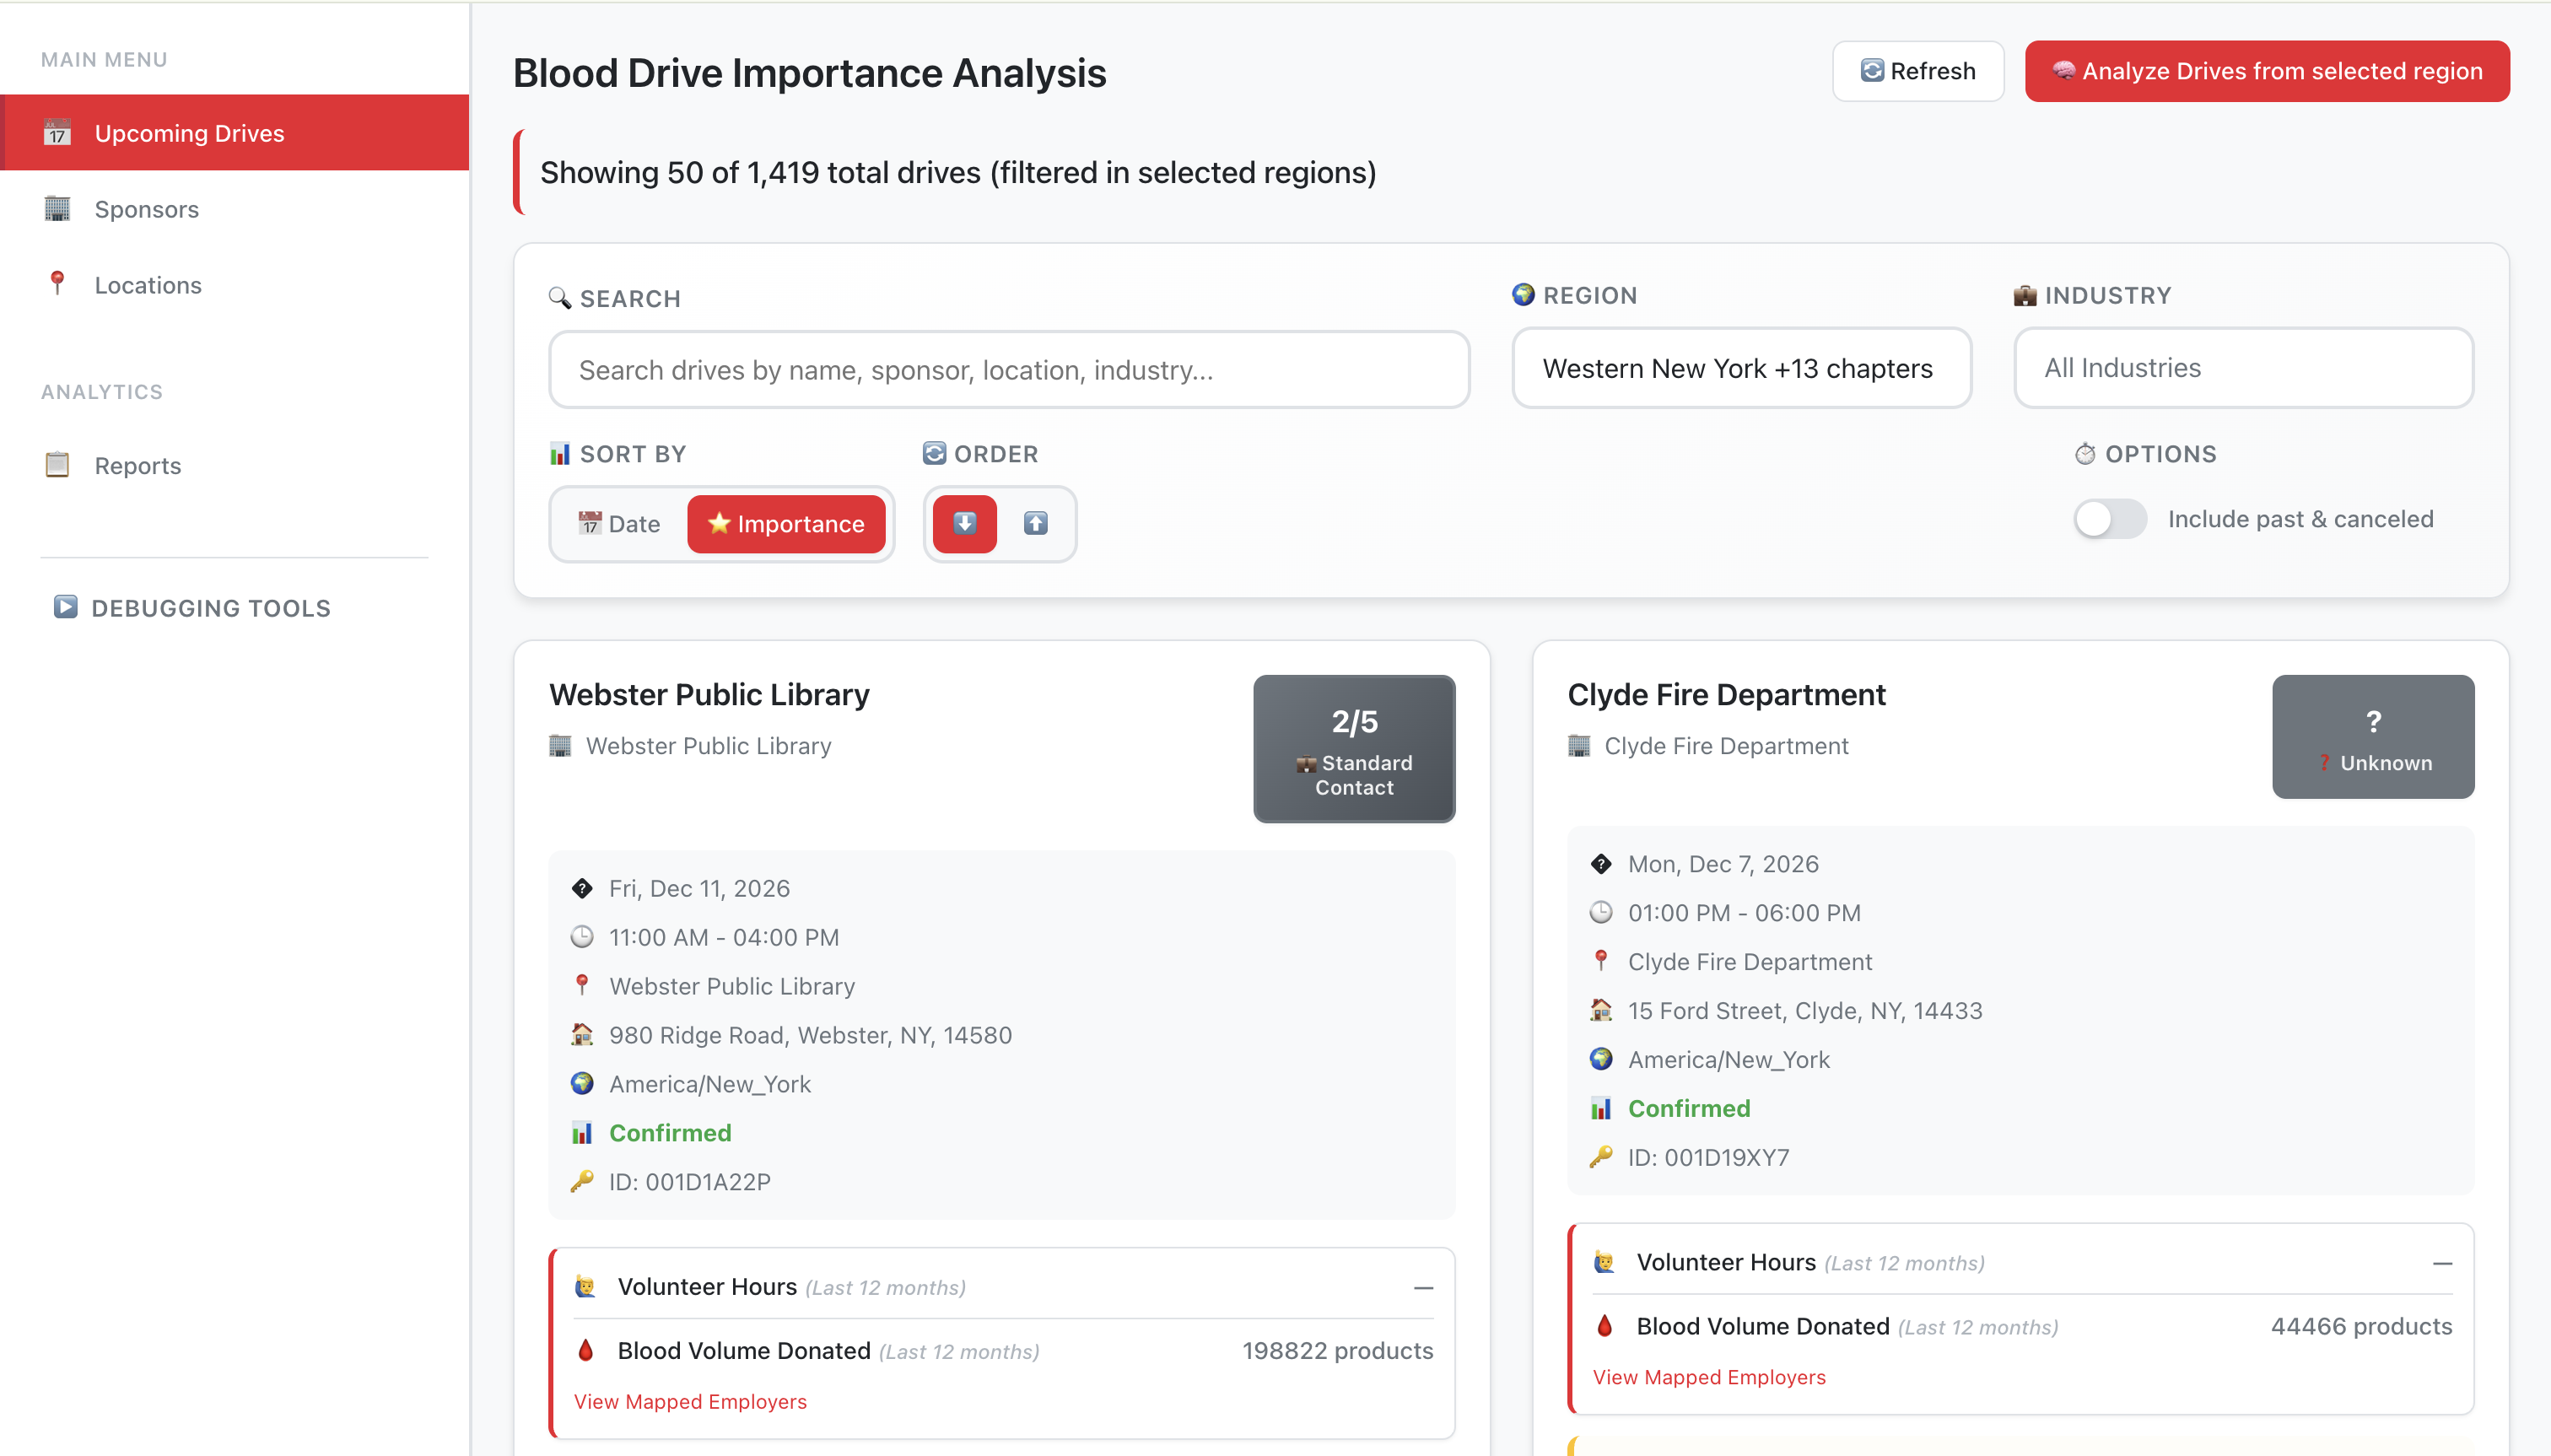
The original drive analysis list
Search and region or industry filters sit above the original report. Planners can sort by date or importance, include past and cancelled events and start regional analysis. A card without a rating displays an explicit Unknown state, keeping the absence of an assessment distinguishable from a low score.
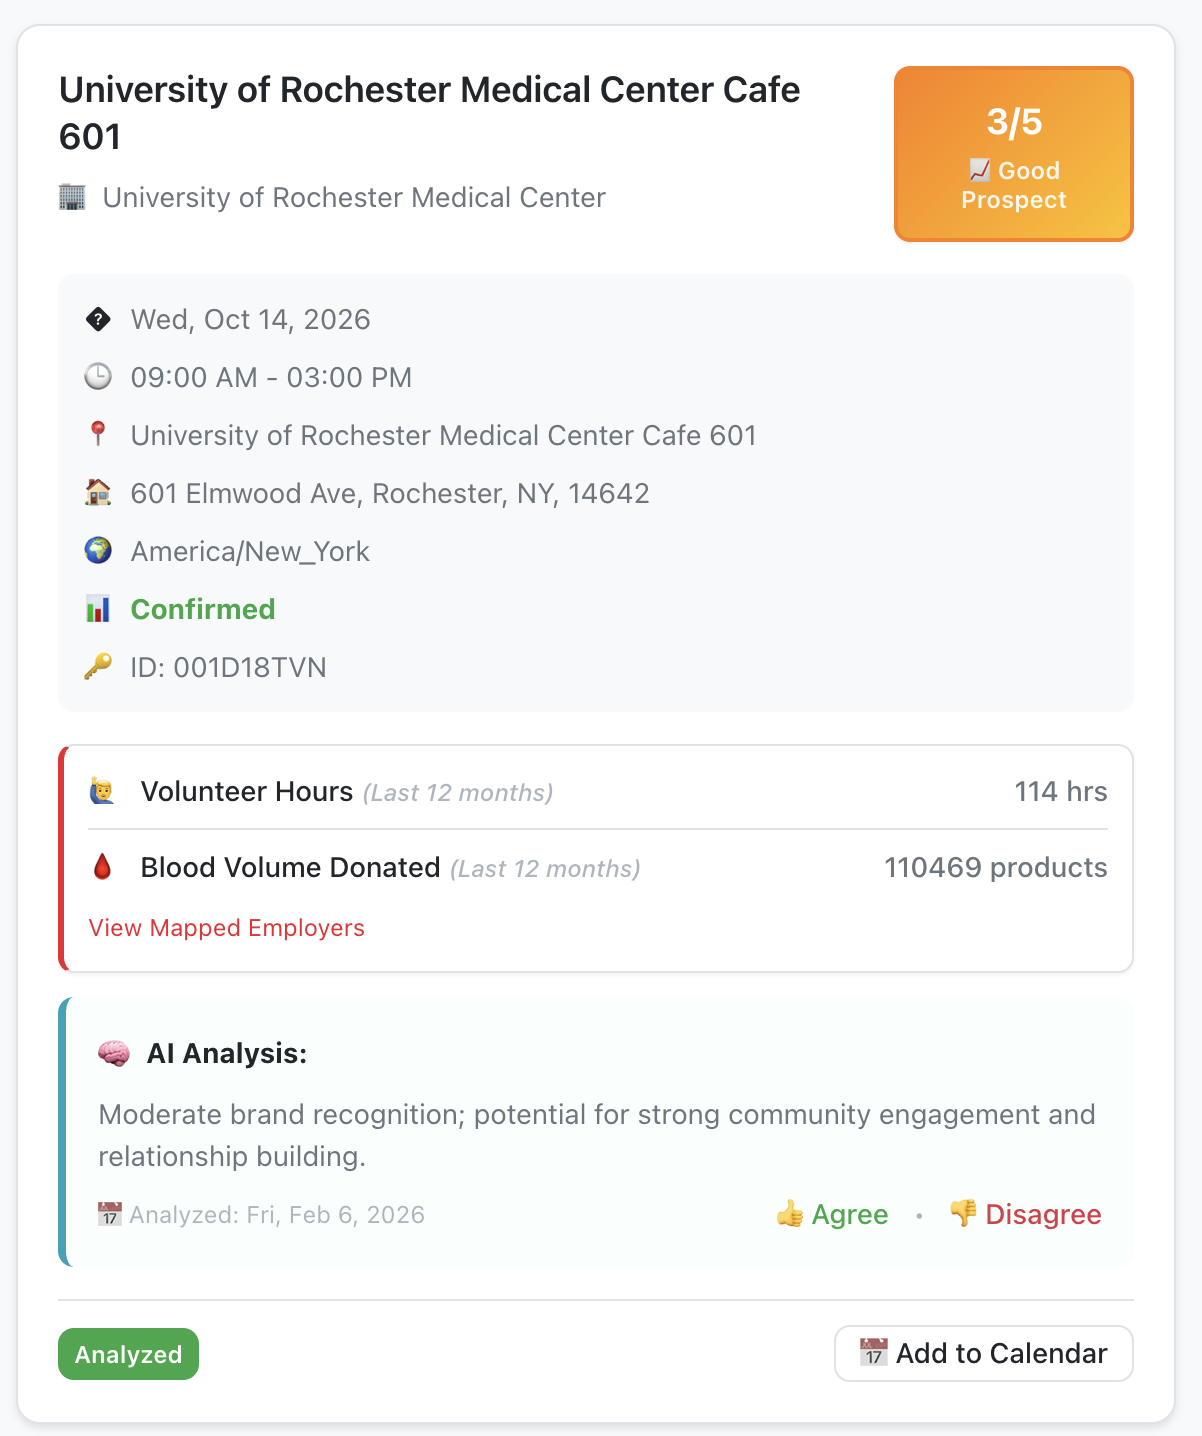
An insight attached to the event
The insight card places the score beside the event’s date, location and confirmed status. Historical volunteer and collection figures appear above the generated explanation. Its timestamp and agreement controls keep the assessment connected to both its source context and the reviewer’s response.
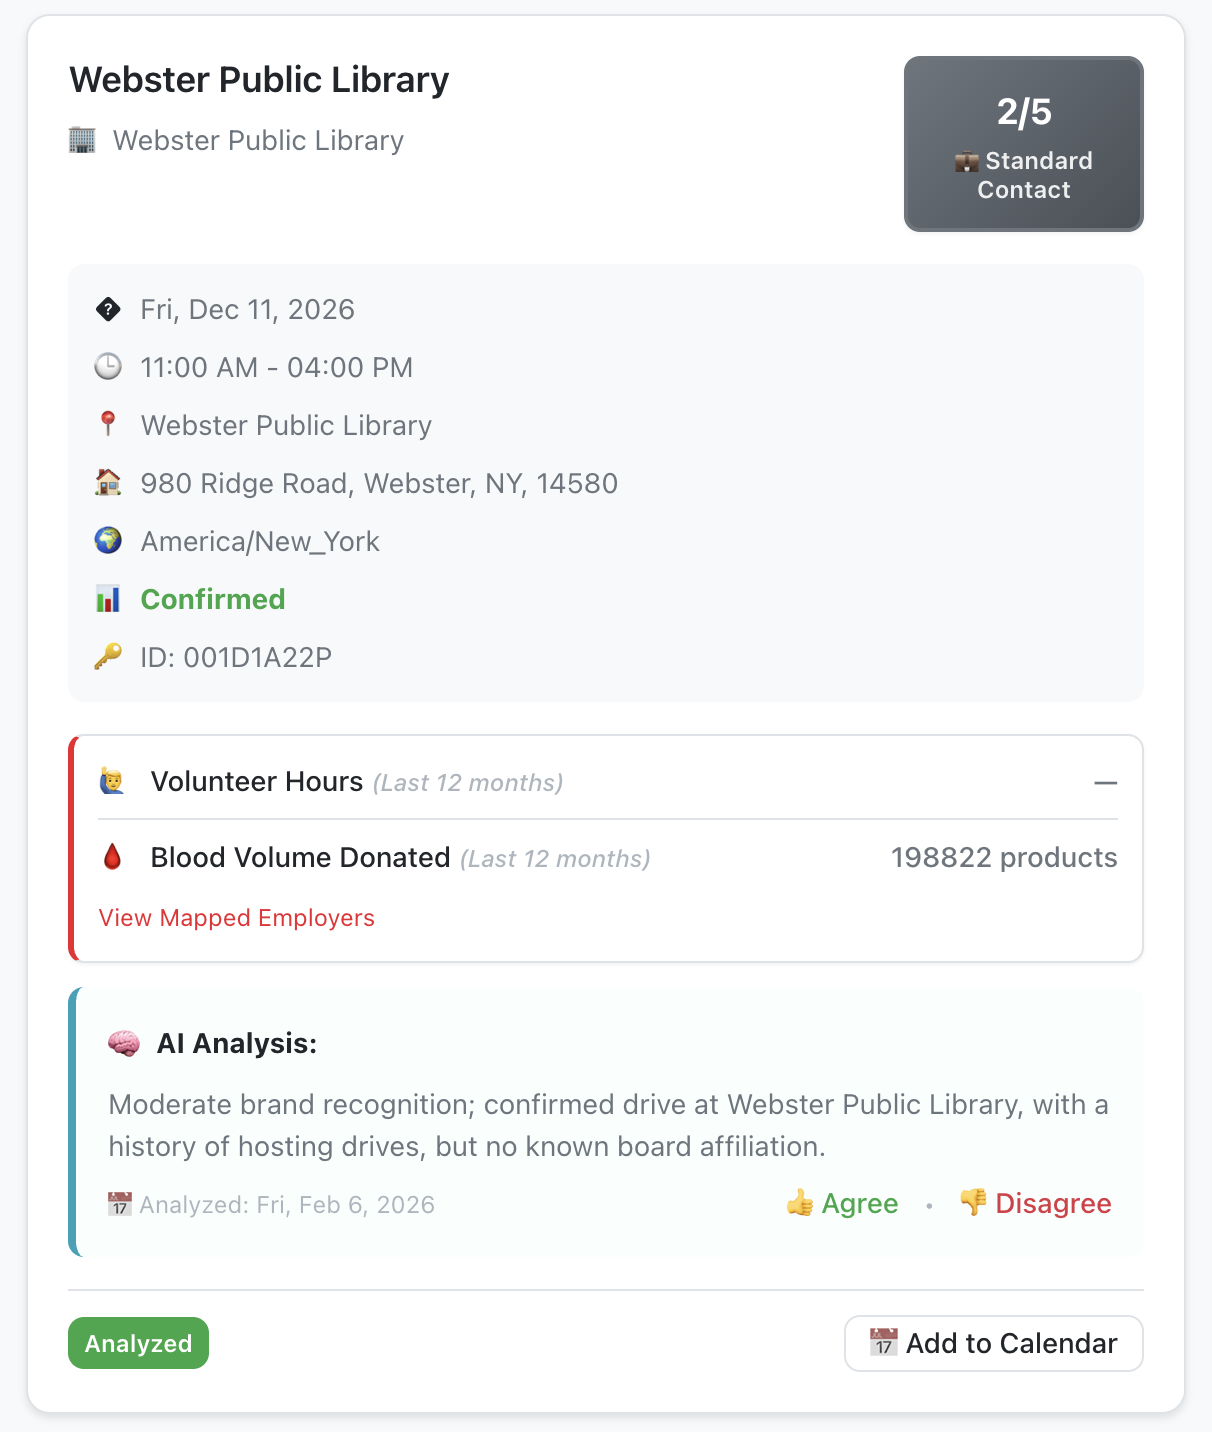
Available data and a different priority
A second card shows a different priority and leaves the unavailable volunteer-hours value as a dash. The summary describes the available sponsor and hosting context. Comparing these cards shows why the team needs to review both the score and the information actually present for each event.
The technology behind OpportunityIQ.
A planning interface connected to drive records, weighted scoring and AI-assisted analysis.
Planning interface
SvelteKit and TypeScript provide the search, calendar and opportunity views.
Scoring services
NestJS services process reporting inputs and connect the ranking with the planning workspace.
Drive and sponsor records
MongoDB and Azure SQL Database support the records used in planning and analysis.
AI-assisted analysis
Bedrock supports the summaries that planners review alongside drive history and sponsor signals.
Cloud services
Azure services support the application and its cross-cloud data synchronisation.
Build a planning tool your team can explain and review.
Start with the decisions your team repeats, the data behind them and the rules used to set priorities. We can connect those inputs with scoring, explanations and a review workflow in one application.
Discuss your planning tool