
Dispatched
60/ 100 units
- Still to dispatch
- 40 units
One order. Sales, stock and settlement in context.
Custom ERP and CRM for trading operations. GBA connects customer orders with goods, delivery records and multi-currency settlement, while each department works in its own console views.
The following workflows show how staff inspect order lines, locate goods, reconcile receipts and assign follow-up work. Each view keeps the operational record available for review.
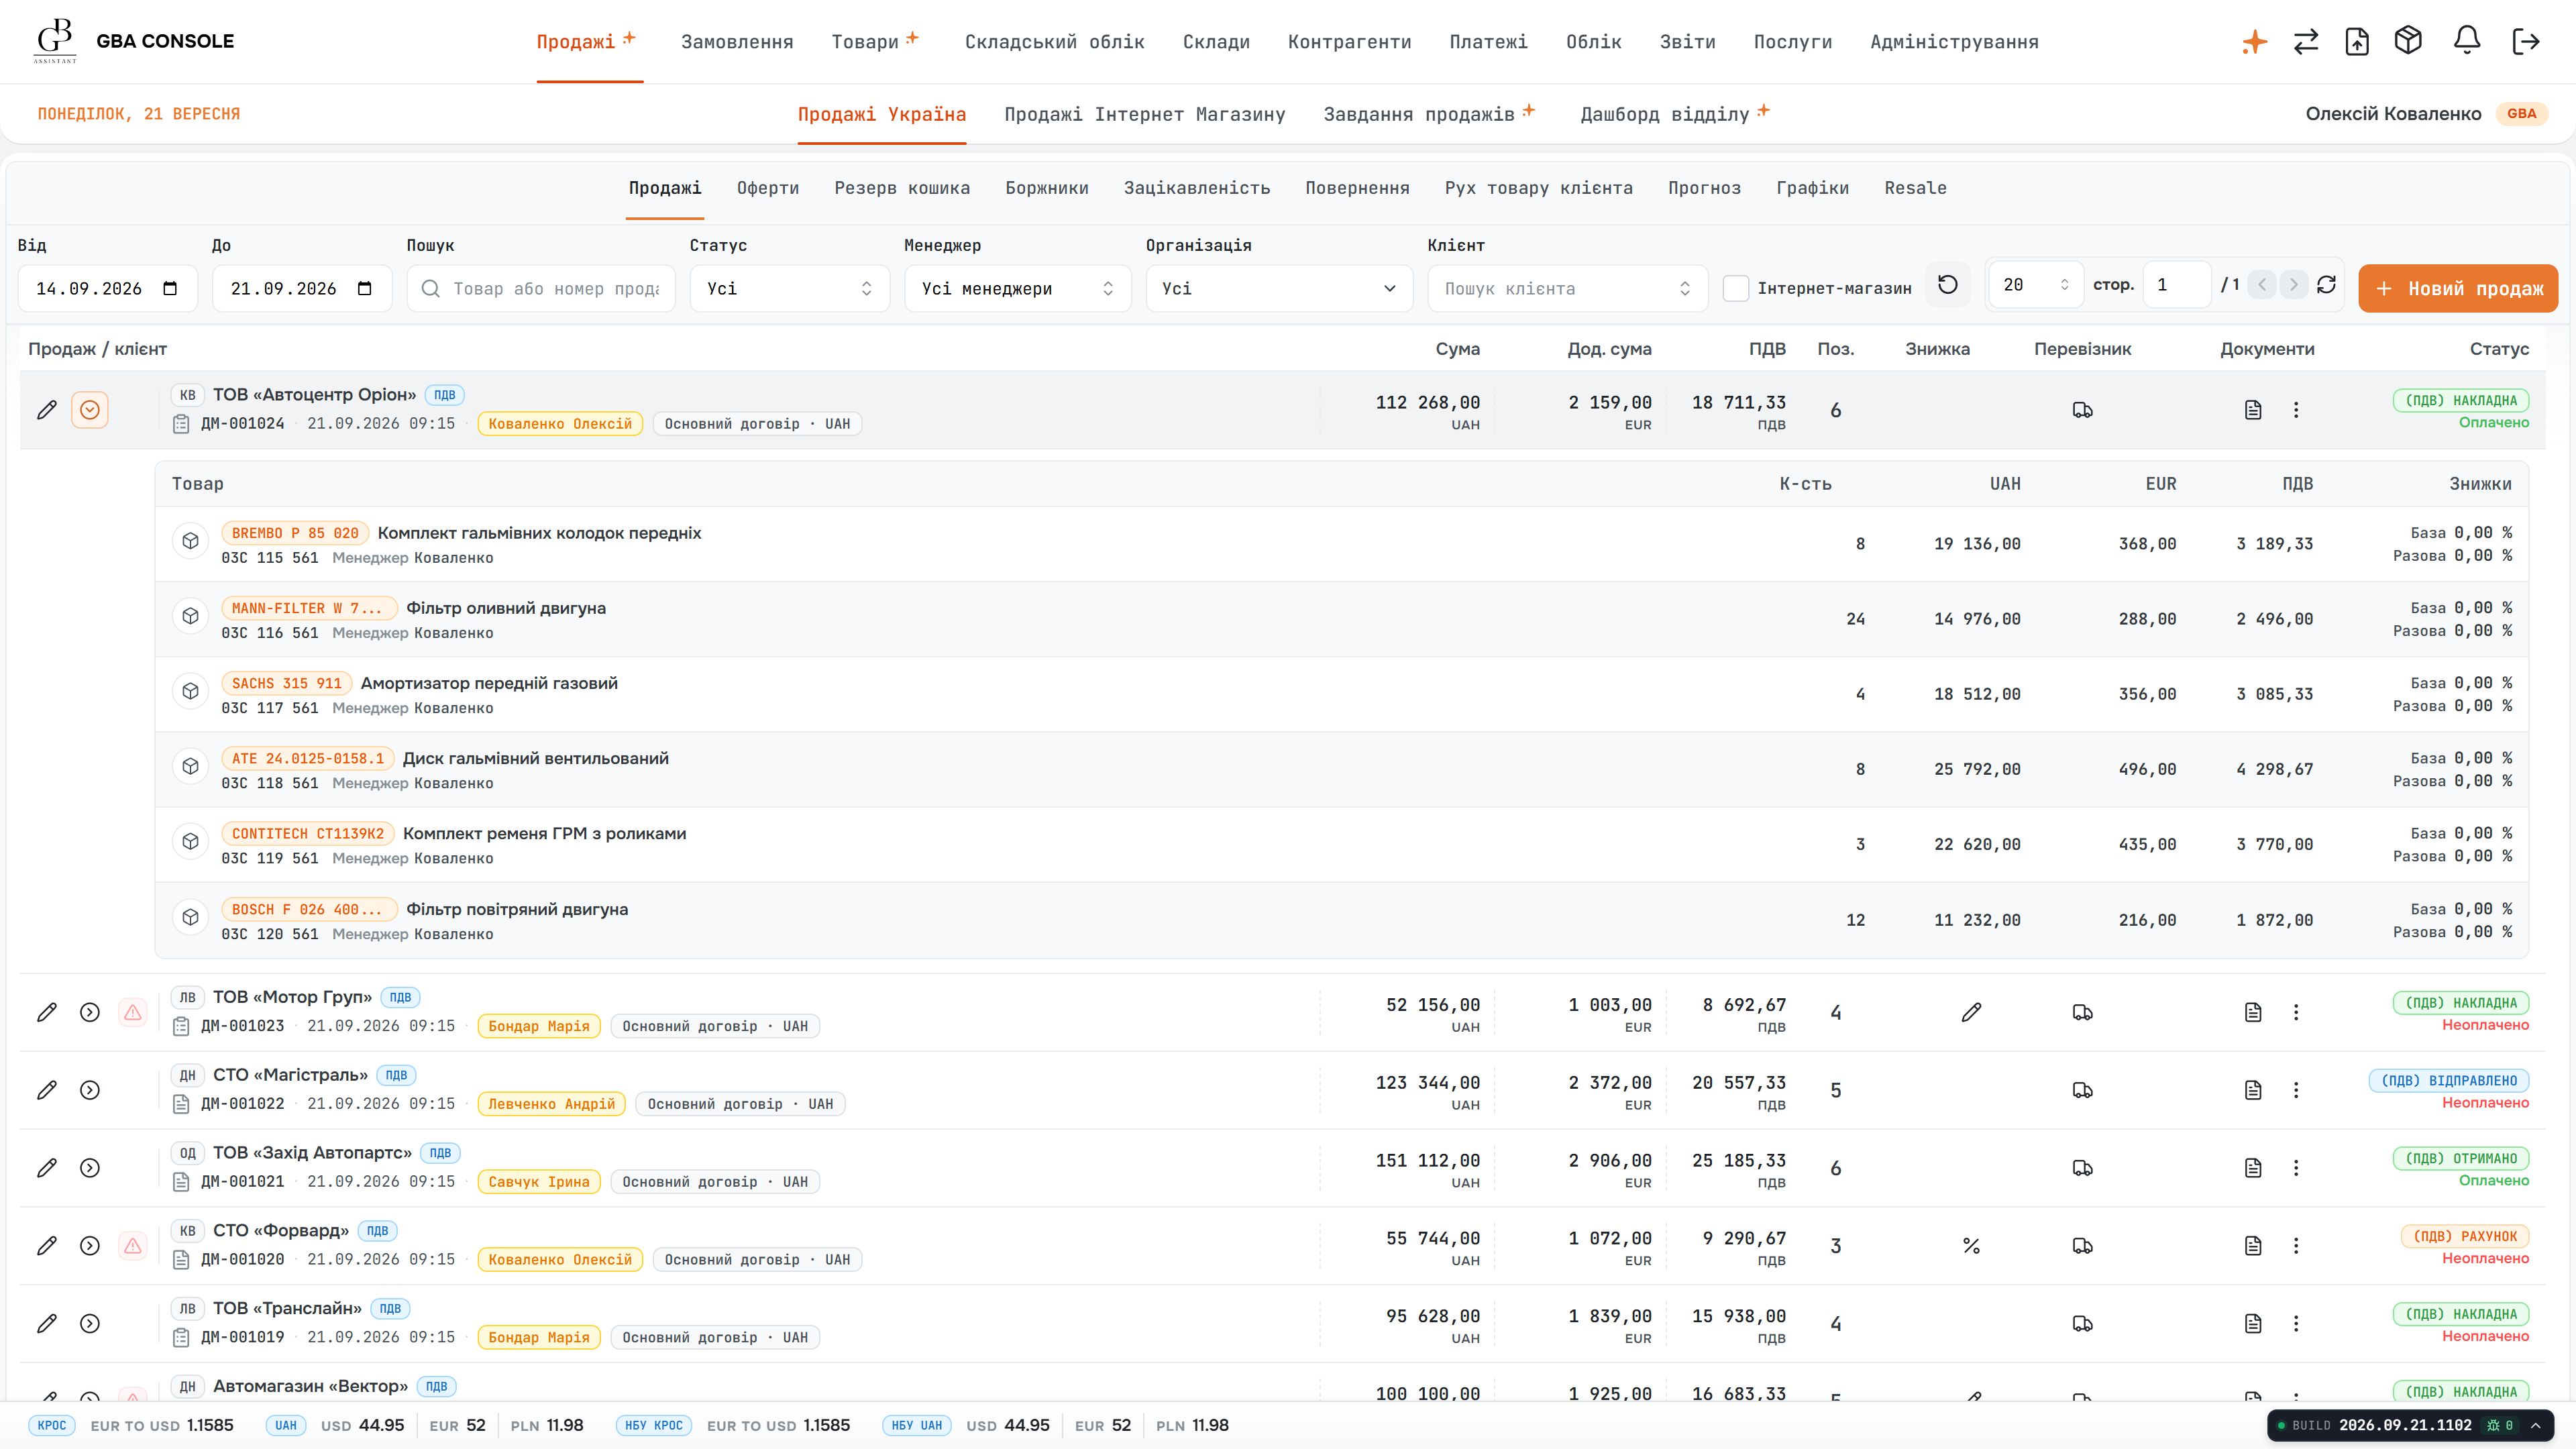
The sales register opens into individual products without losing the order context. Quantities, unit prices and line totals let the manager check what the customer is buying before reviewing delivery or payment.
A customer question can involve the order, the delivery recipient and the wider account history. The sales team needs to check these records together before agreeing the next action.
GBA connects the sales register, line items, delivery details and customer portfolio. The manager can move from a specific sale to the customer’s order history, turnover and overdue balance.
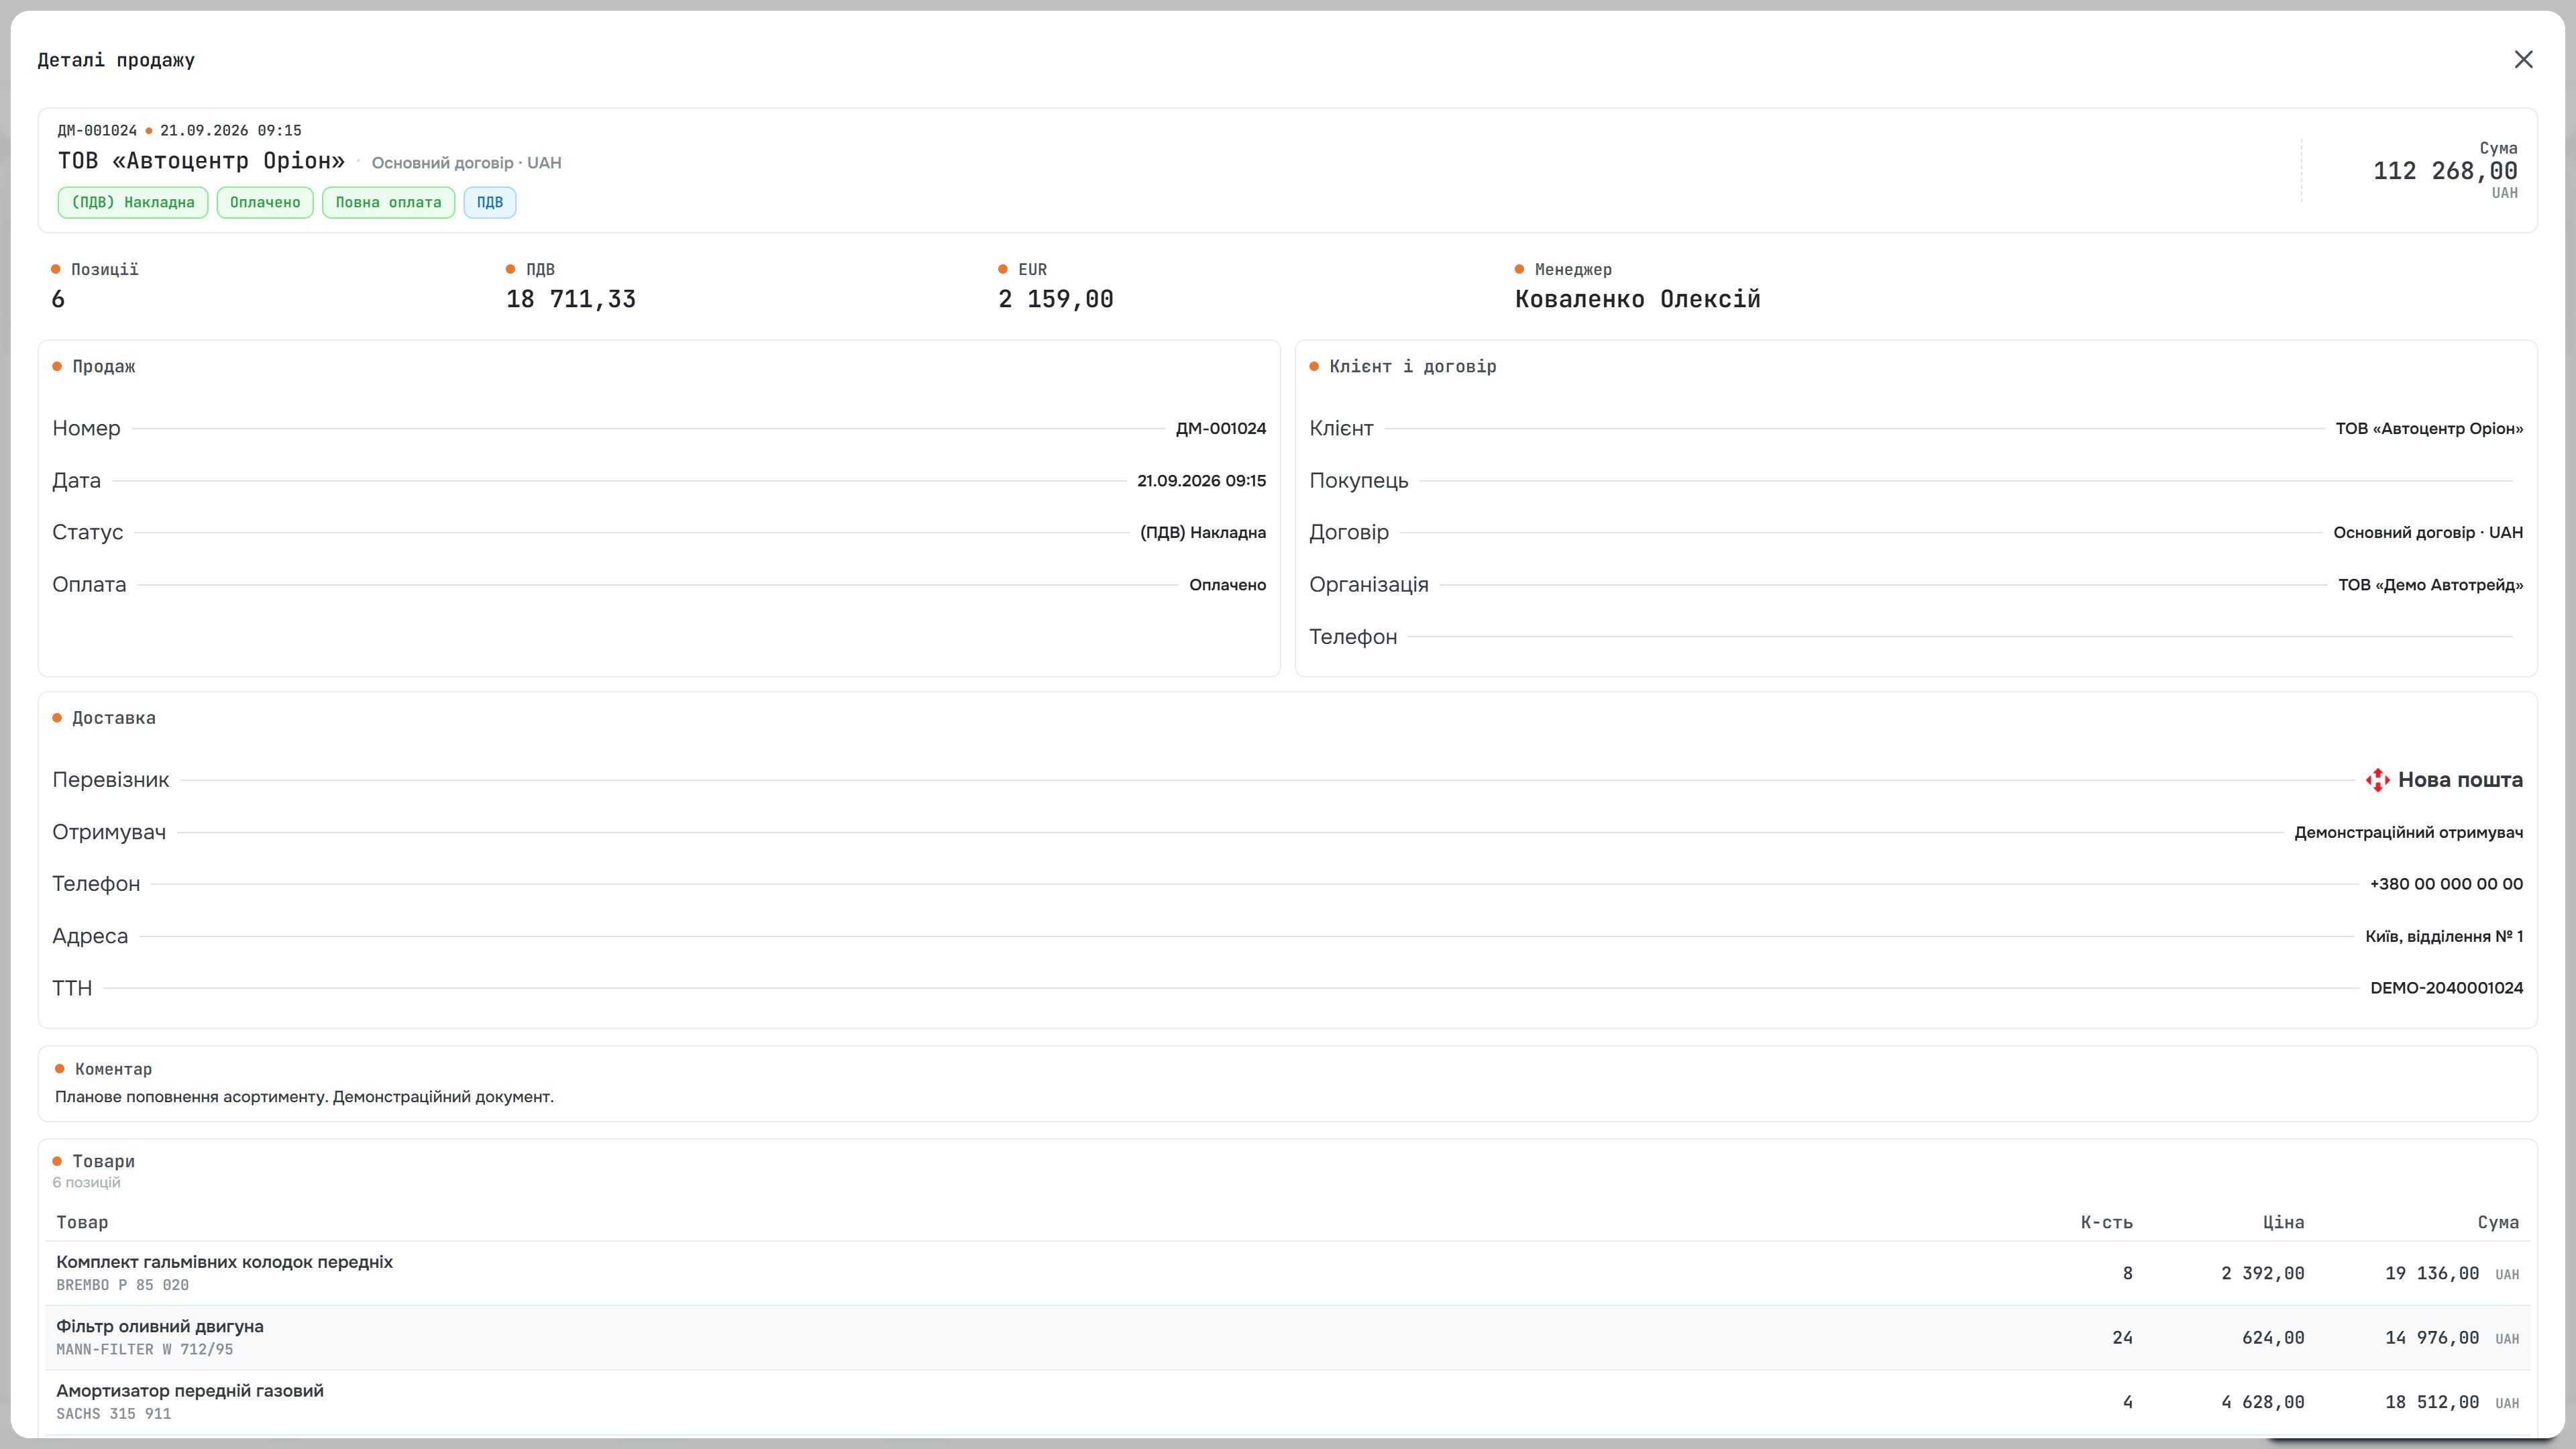
The sale detail brings the customer, manager and delivery recipient into one record. Carrier information and order lines support a concrete conversation about where the goods should go and who is responsible for the sale.
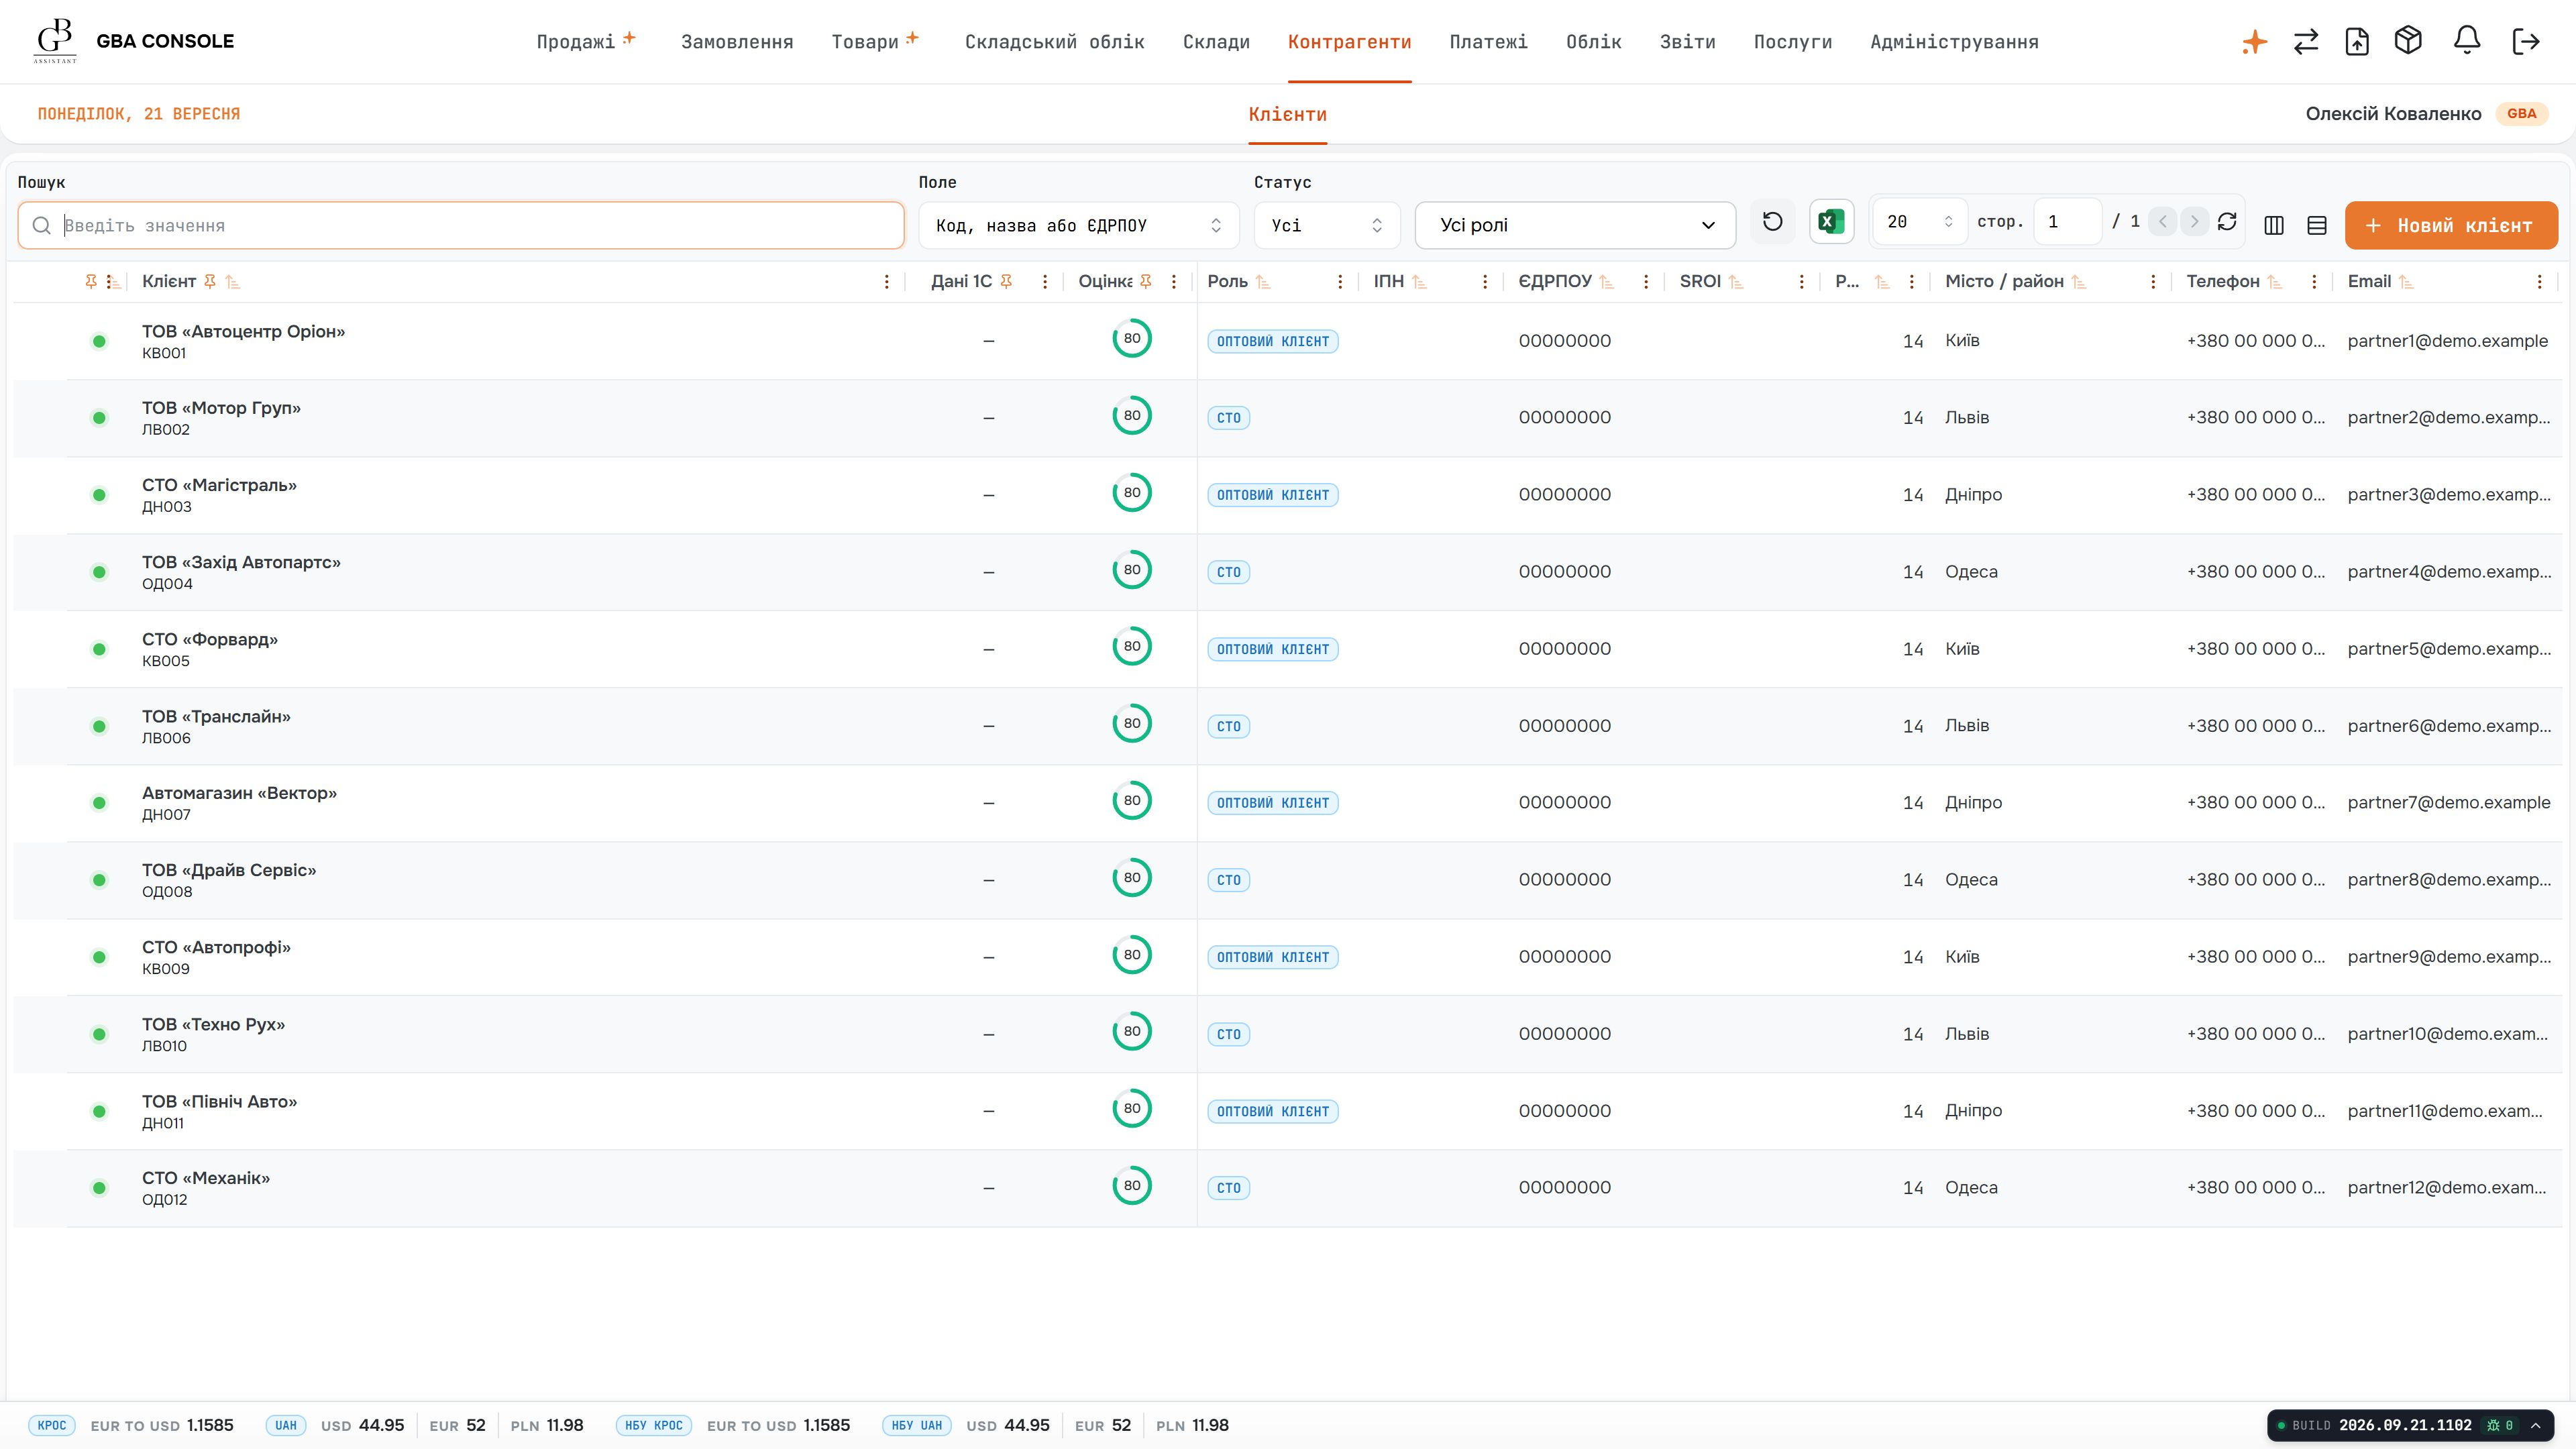
Customer search starts from a shared register with contact details, location and account status. These fields help staff identify the right account before opening its commercial history.
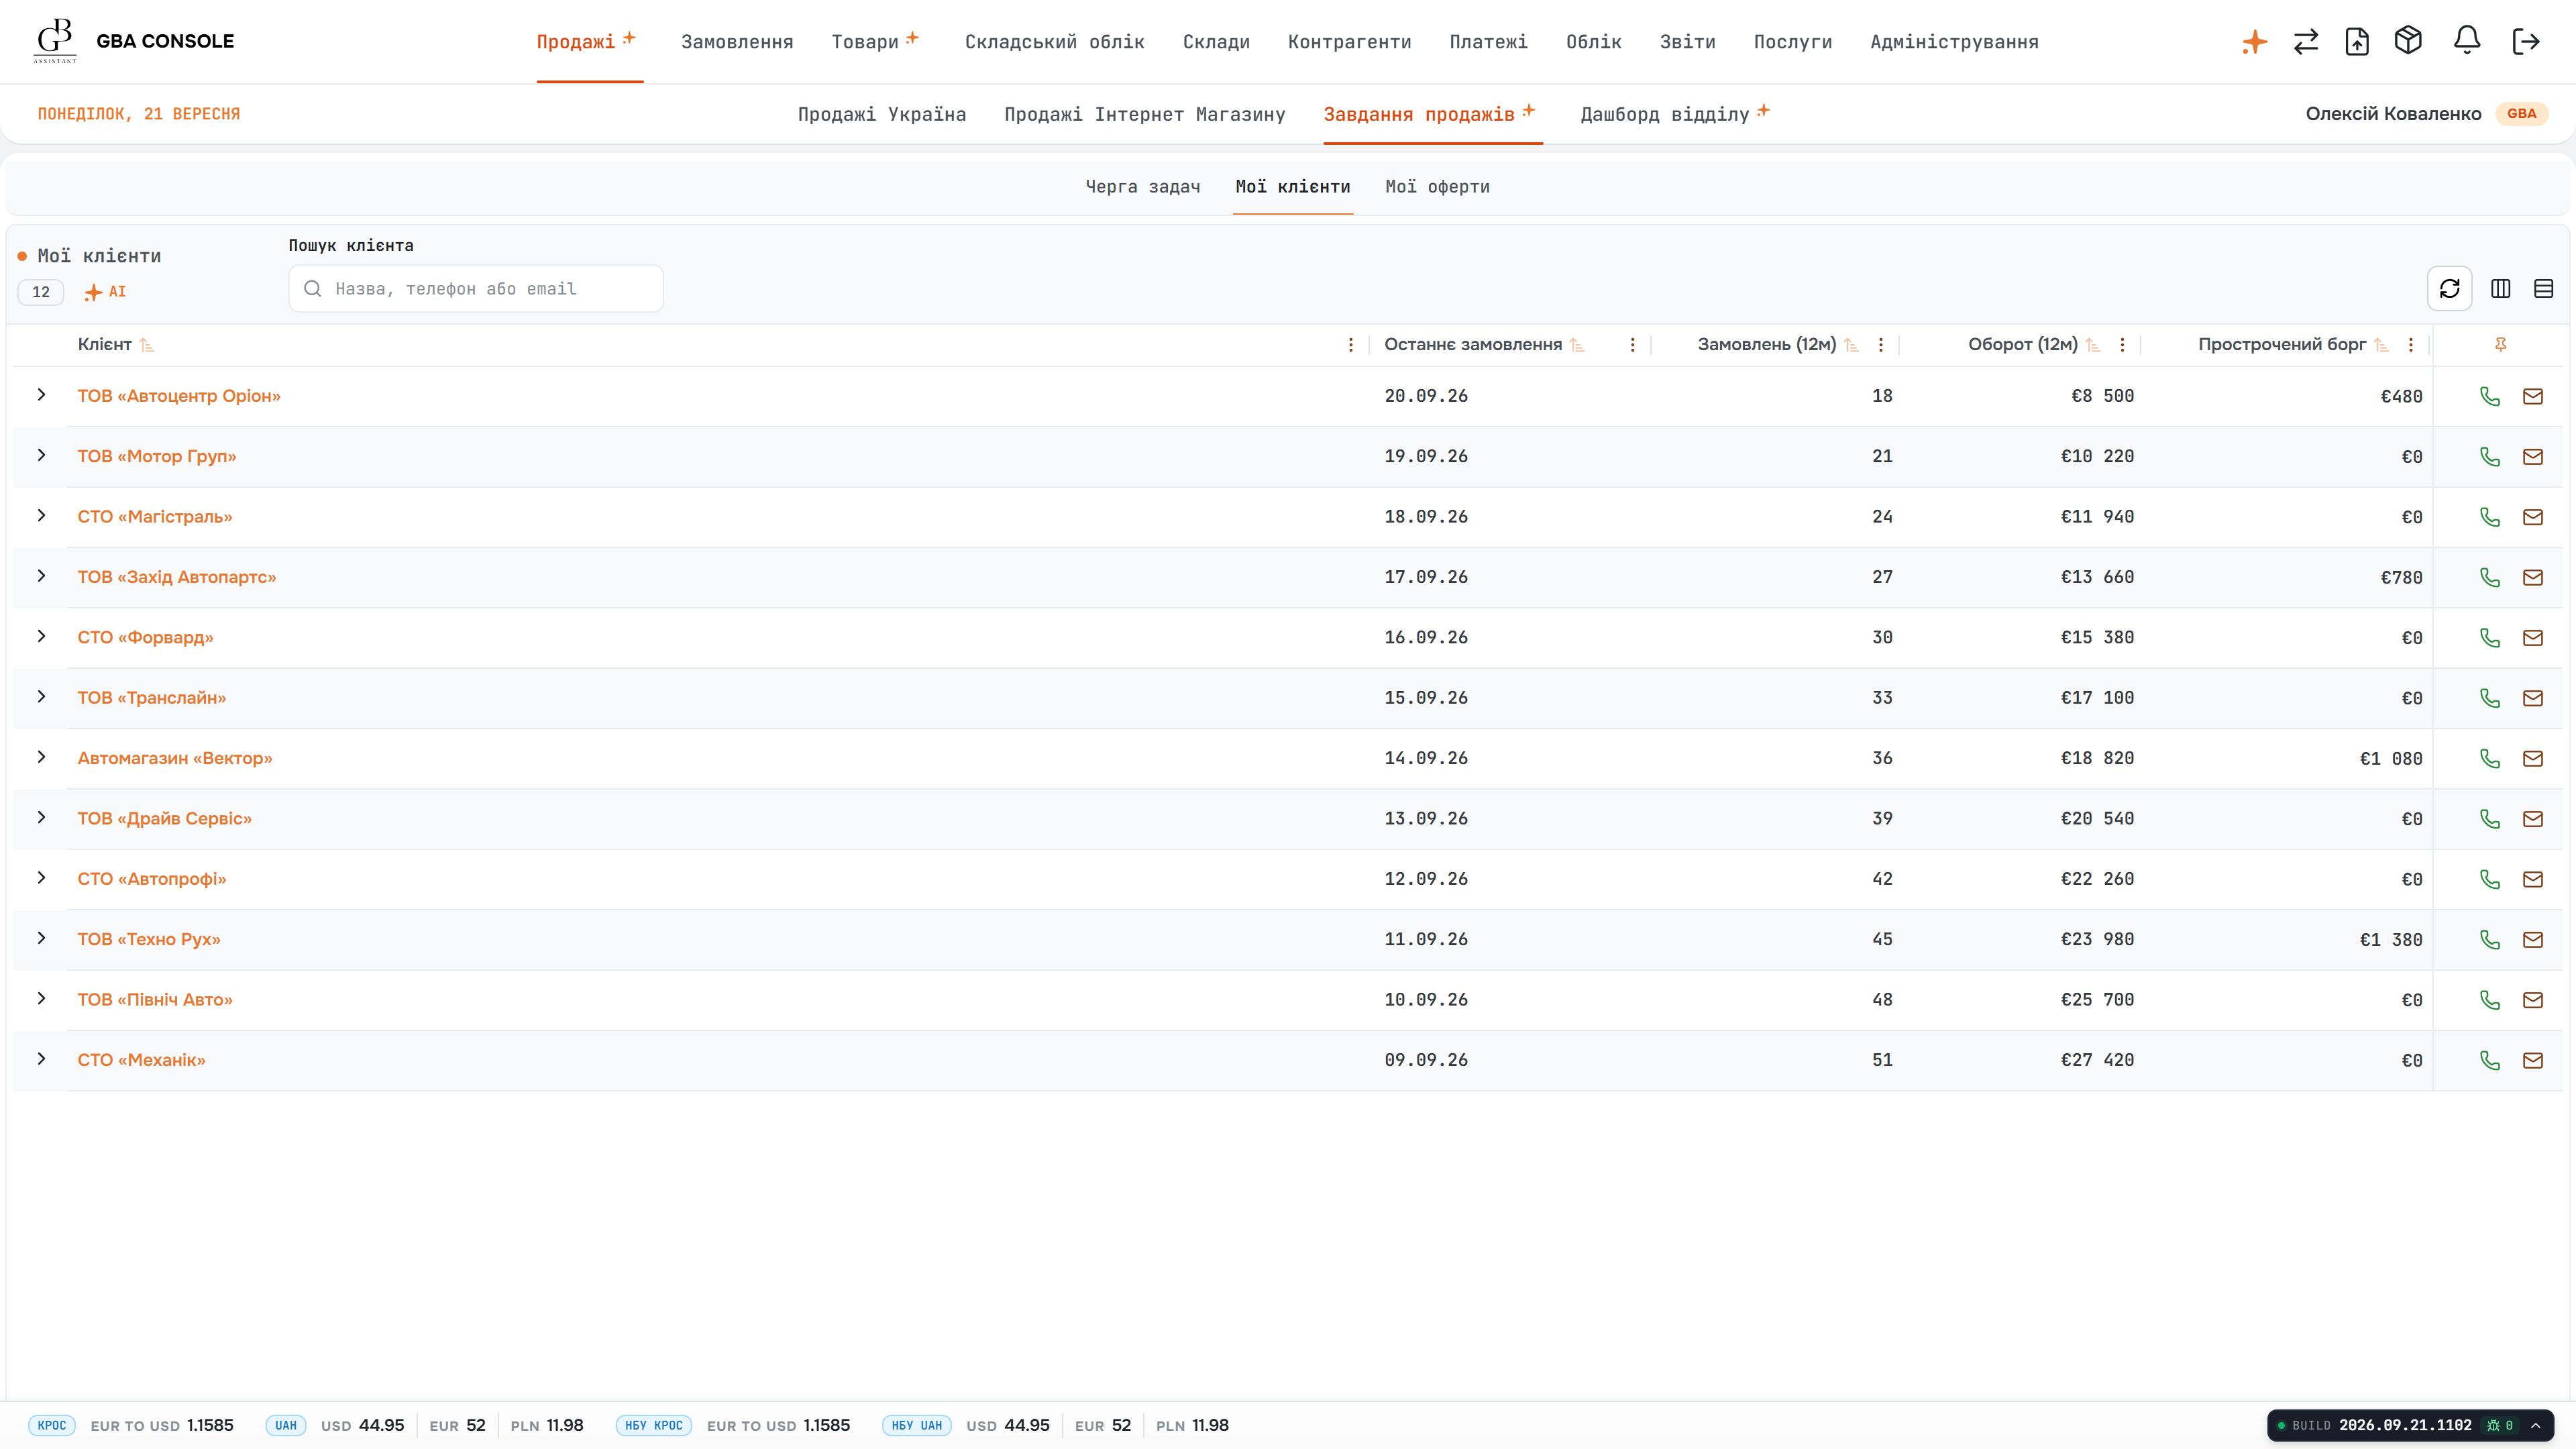
The portfolio puts the last purchase, order volume, turnover and overdue balance beside each account. A manager can prepare a follow-up using the relationship’s activity and financial context together.
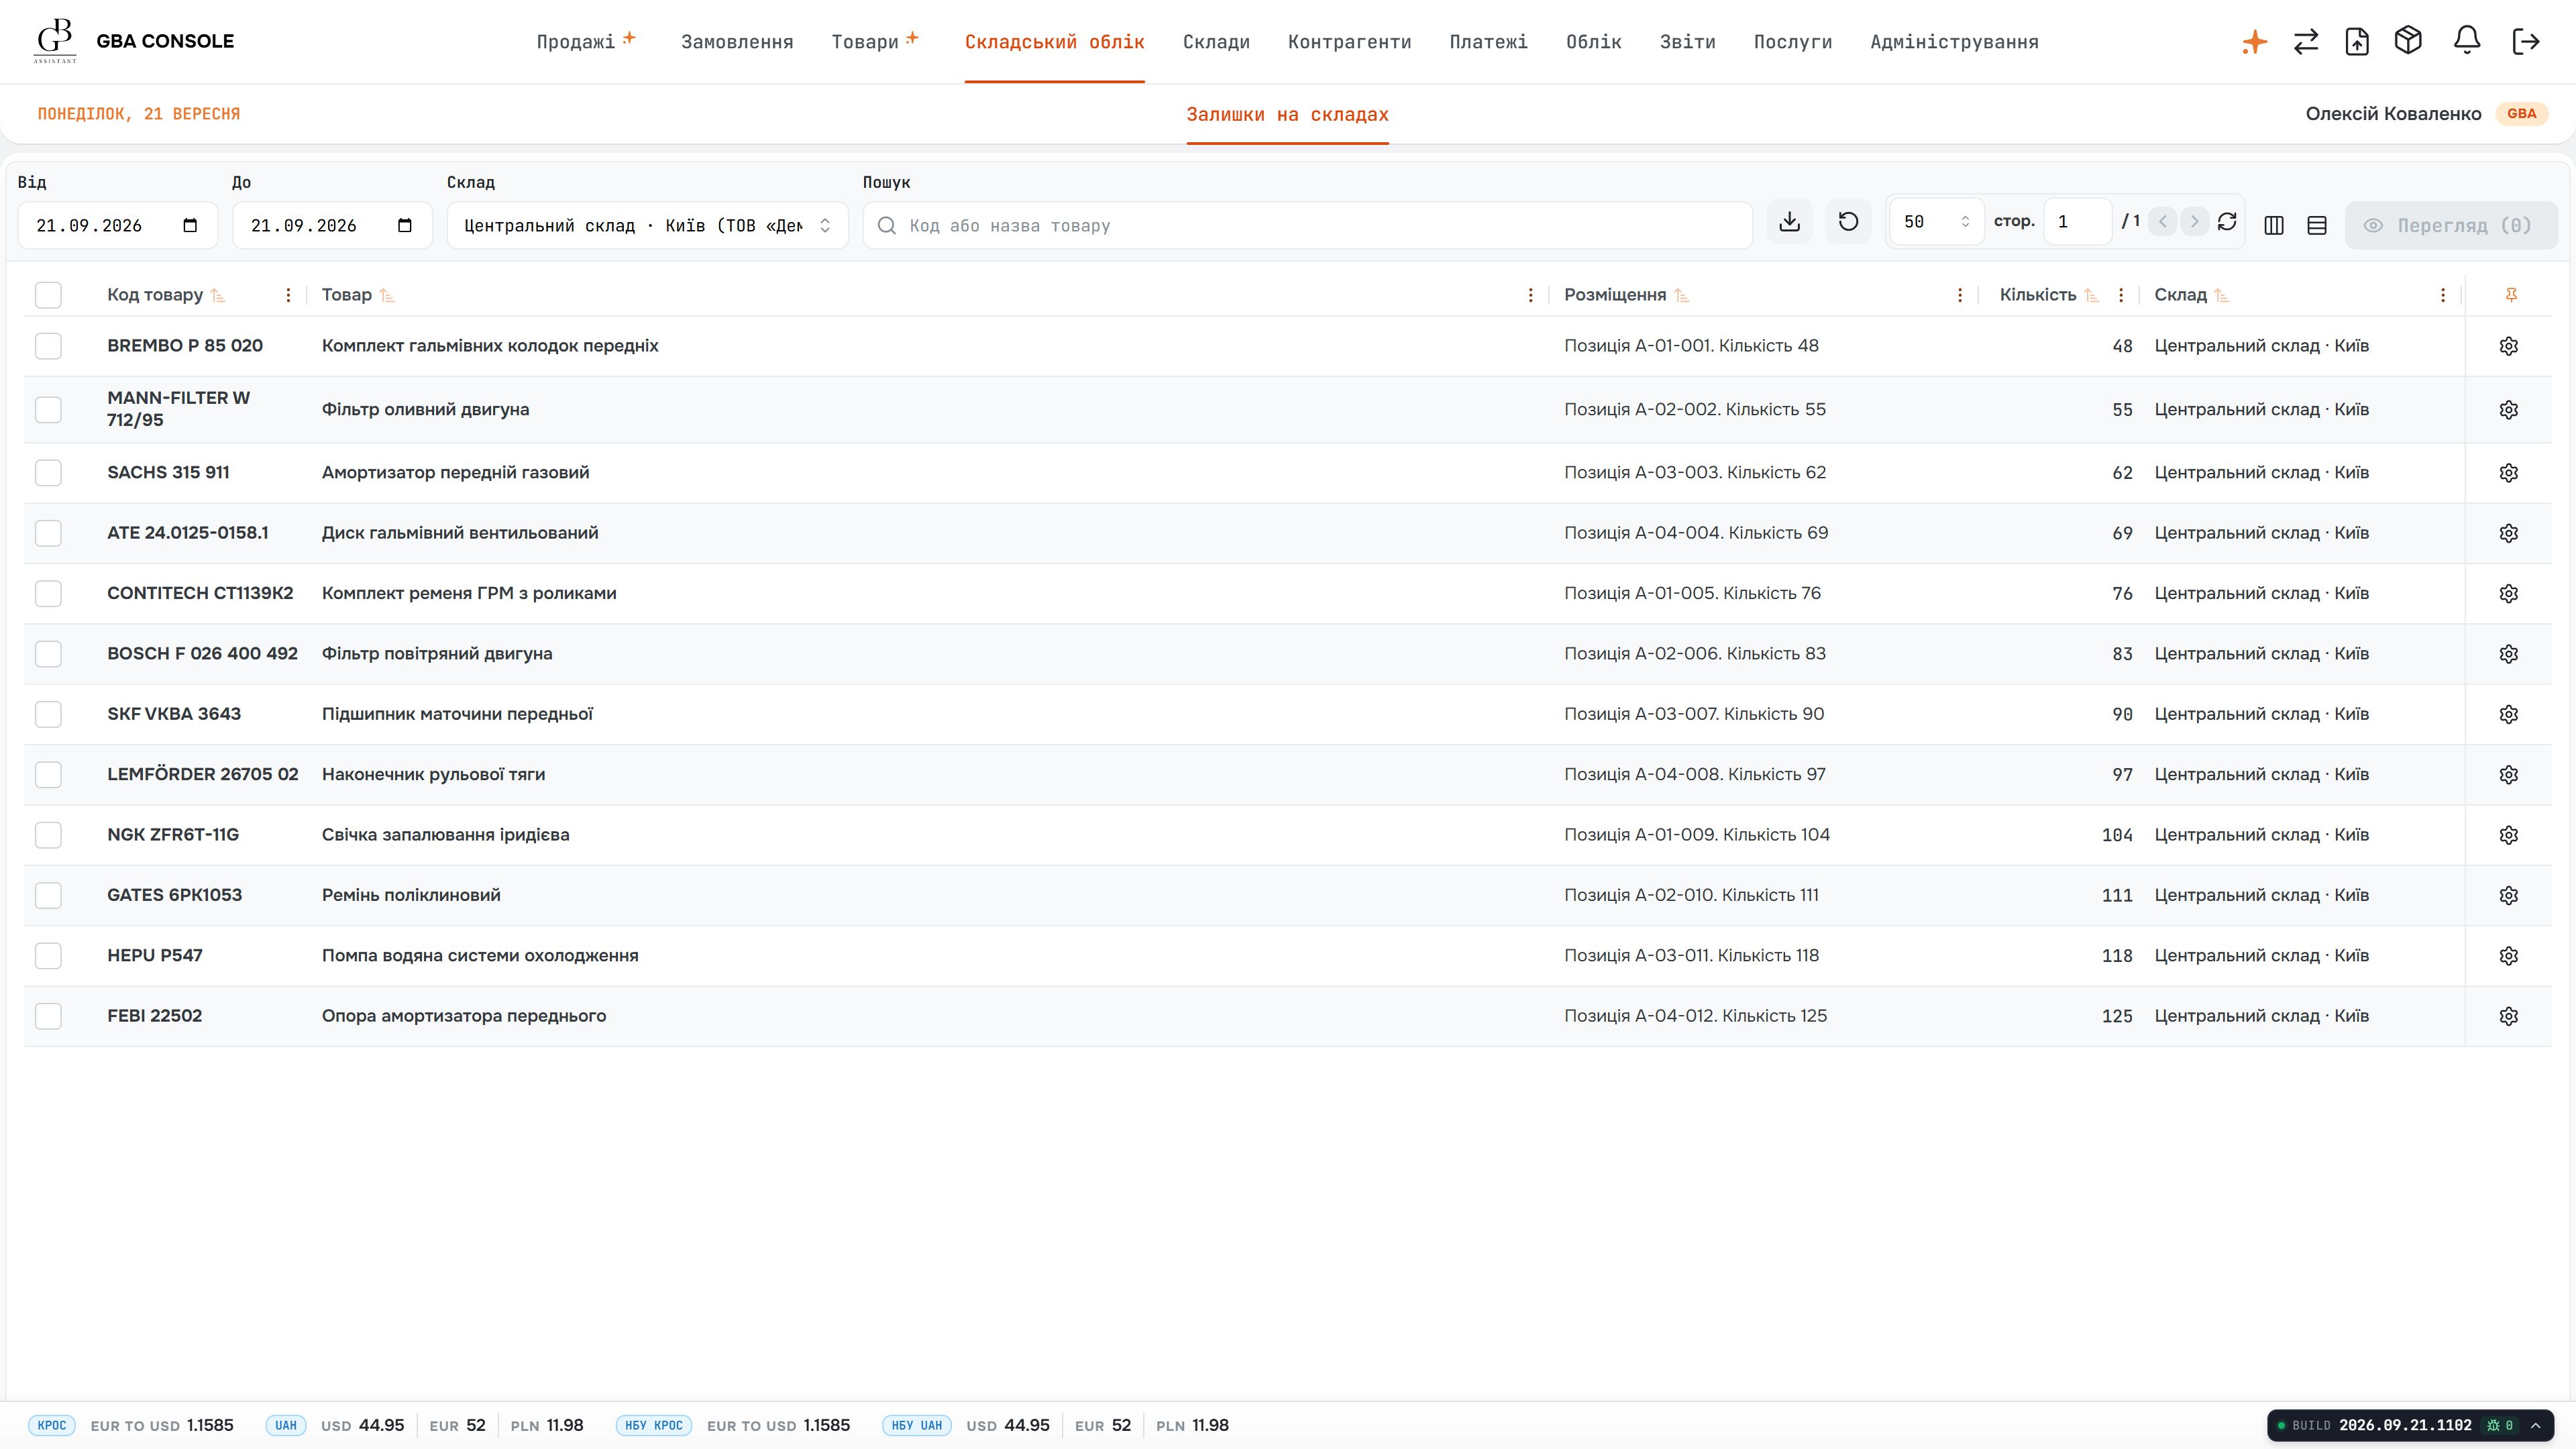
Stock is shown against product references and physical storage locations. The warehouse team can check the relevant quantity and where to find it, instead of relying on an unqualified catalogue total.
An available quantity is only useful when staff can identify the warehouse and storage location behind it. Transfers also need a clear origin, destination and quantity so the next team understands the movement.
The warehouse views link products to quantities, locations and valuation. A separate movement record captures the source and destination warehouses, the transferred amount and the reason for the operation.
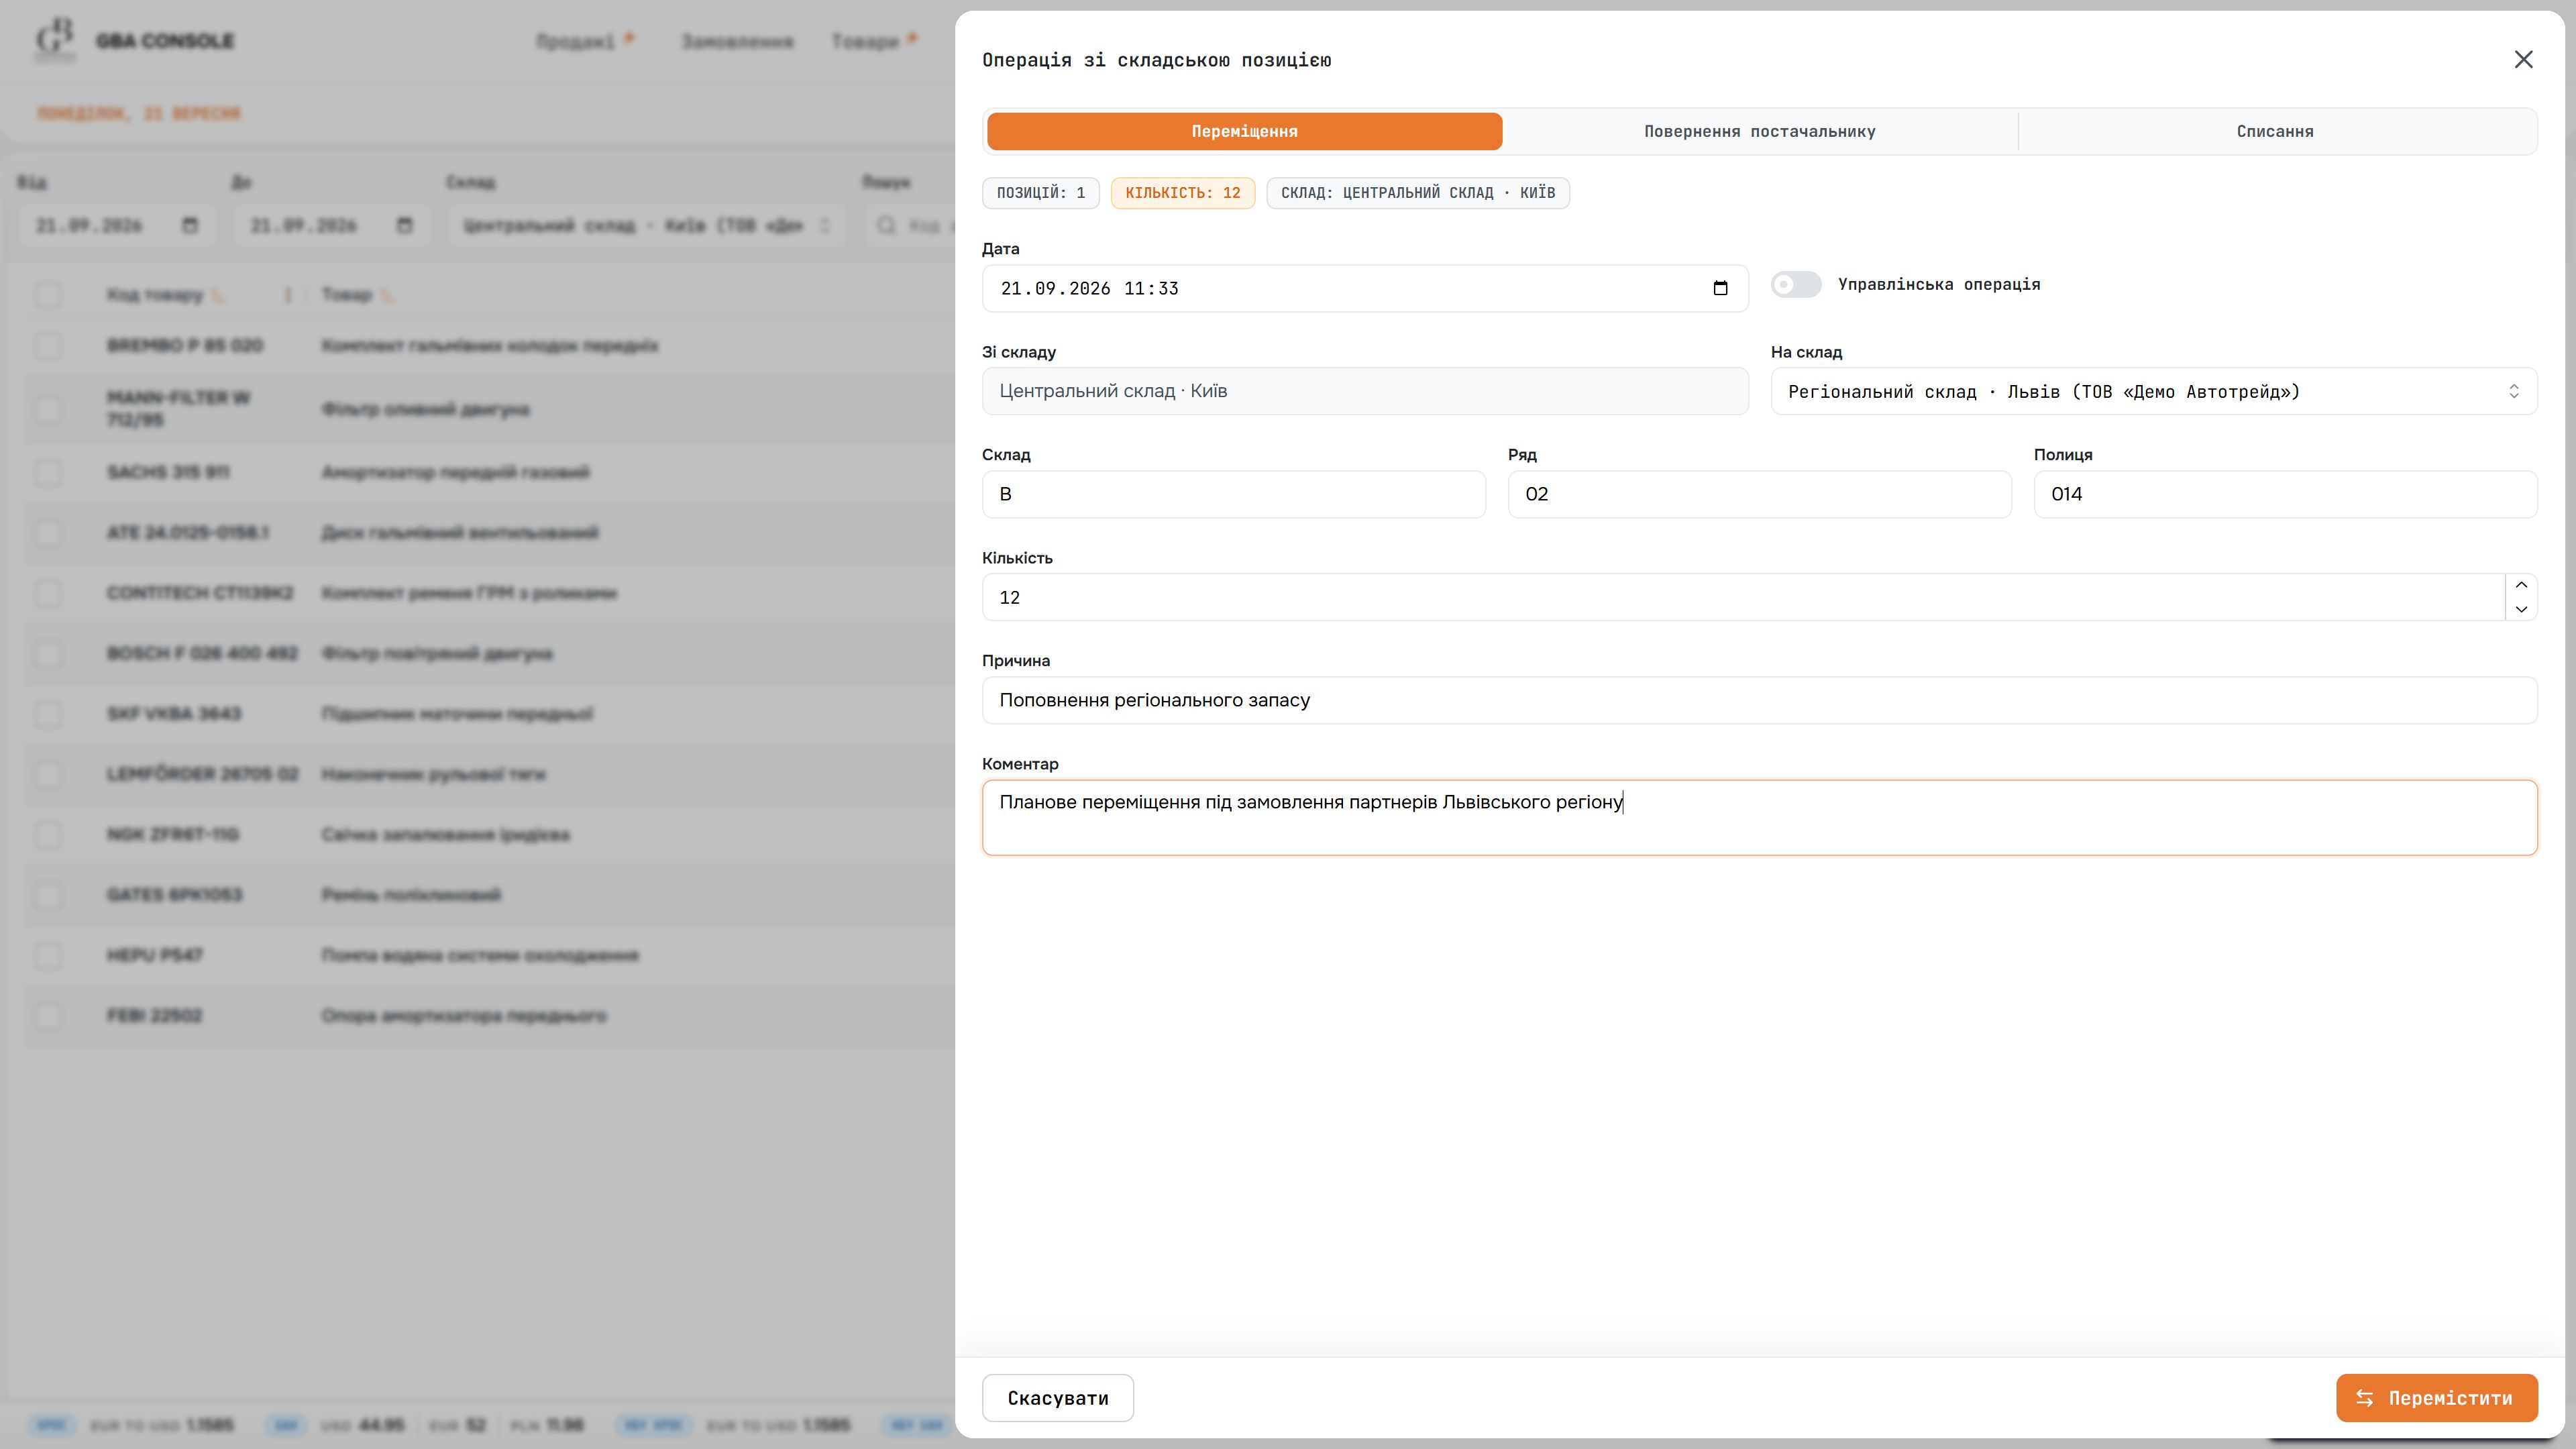
A stock movement is recorded as a specific operation: product, quantity, source and destination warehouses. The reason and comment explain the transfer to the people who will receive or reconcile it.
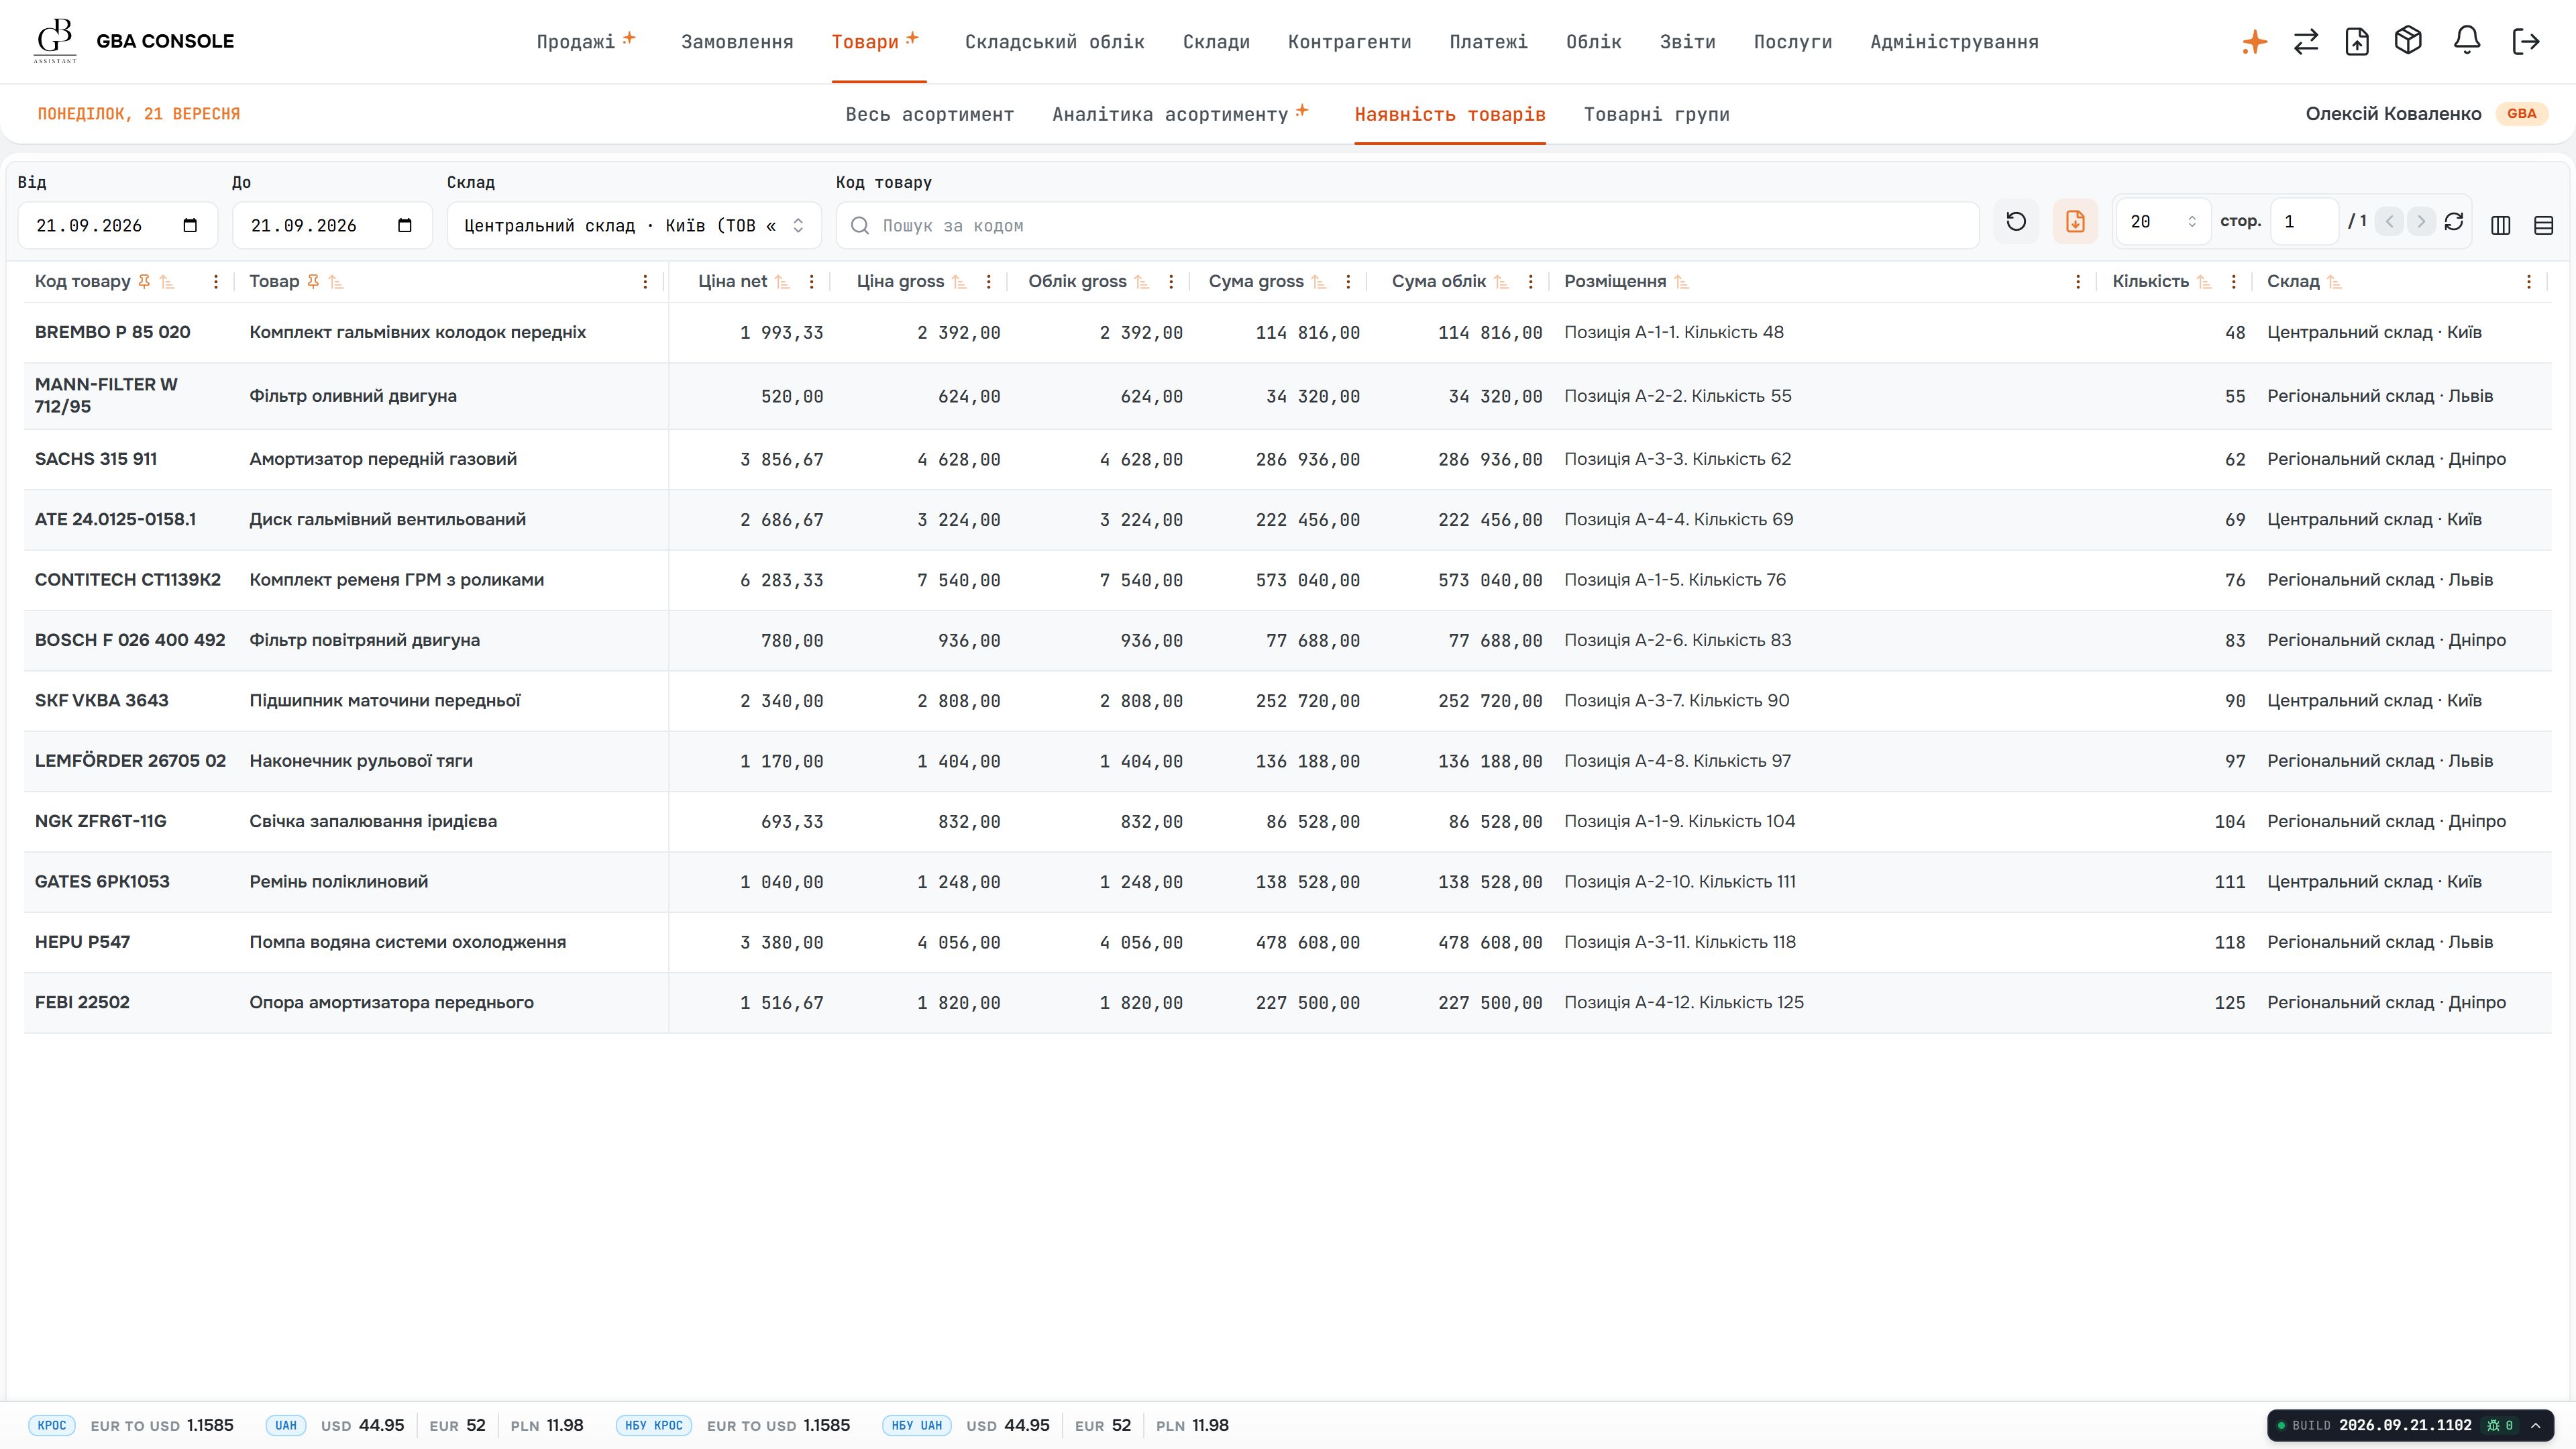
Inventory valuation places quantities beside purchase and selling prices. Purchasing and finance can inspect the value held in stock while retaining the product and location details behind the figure.
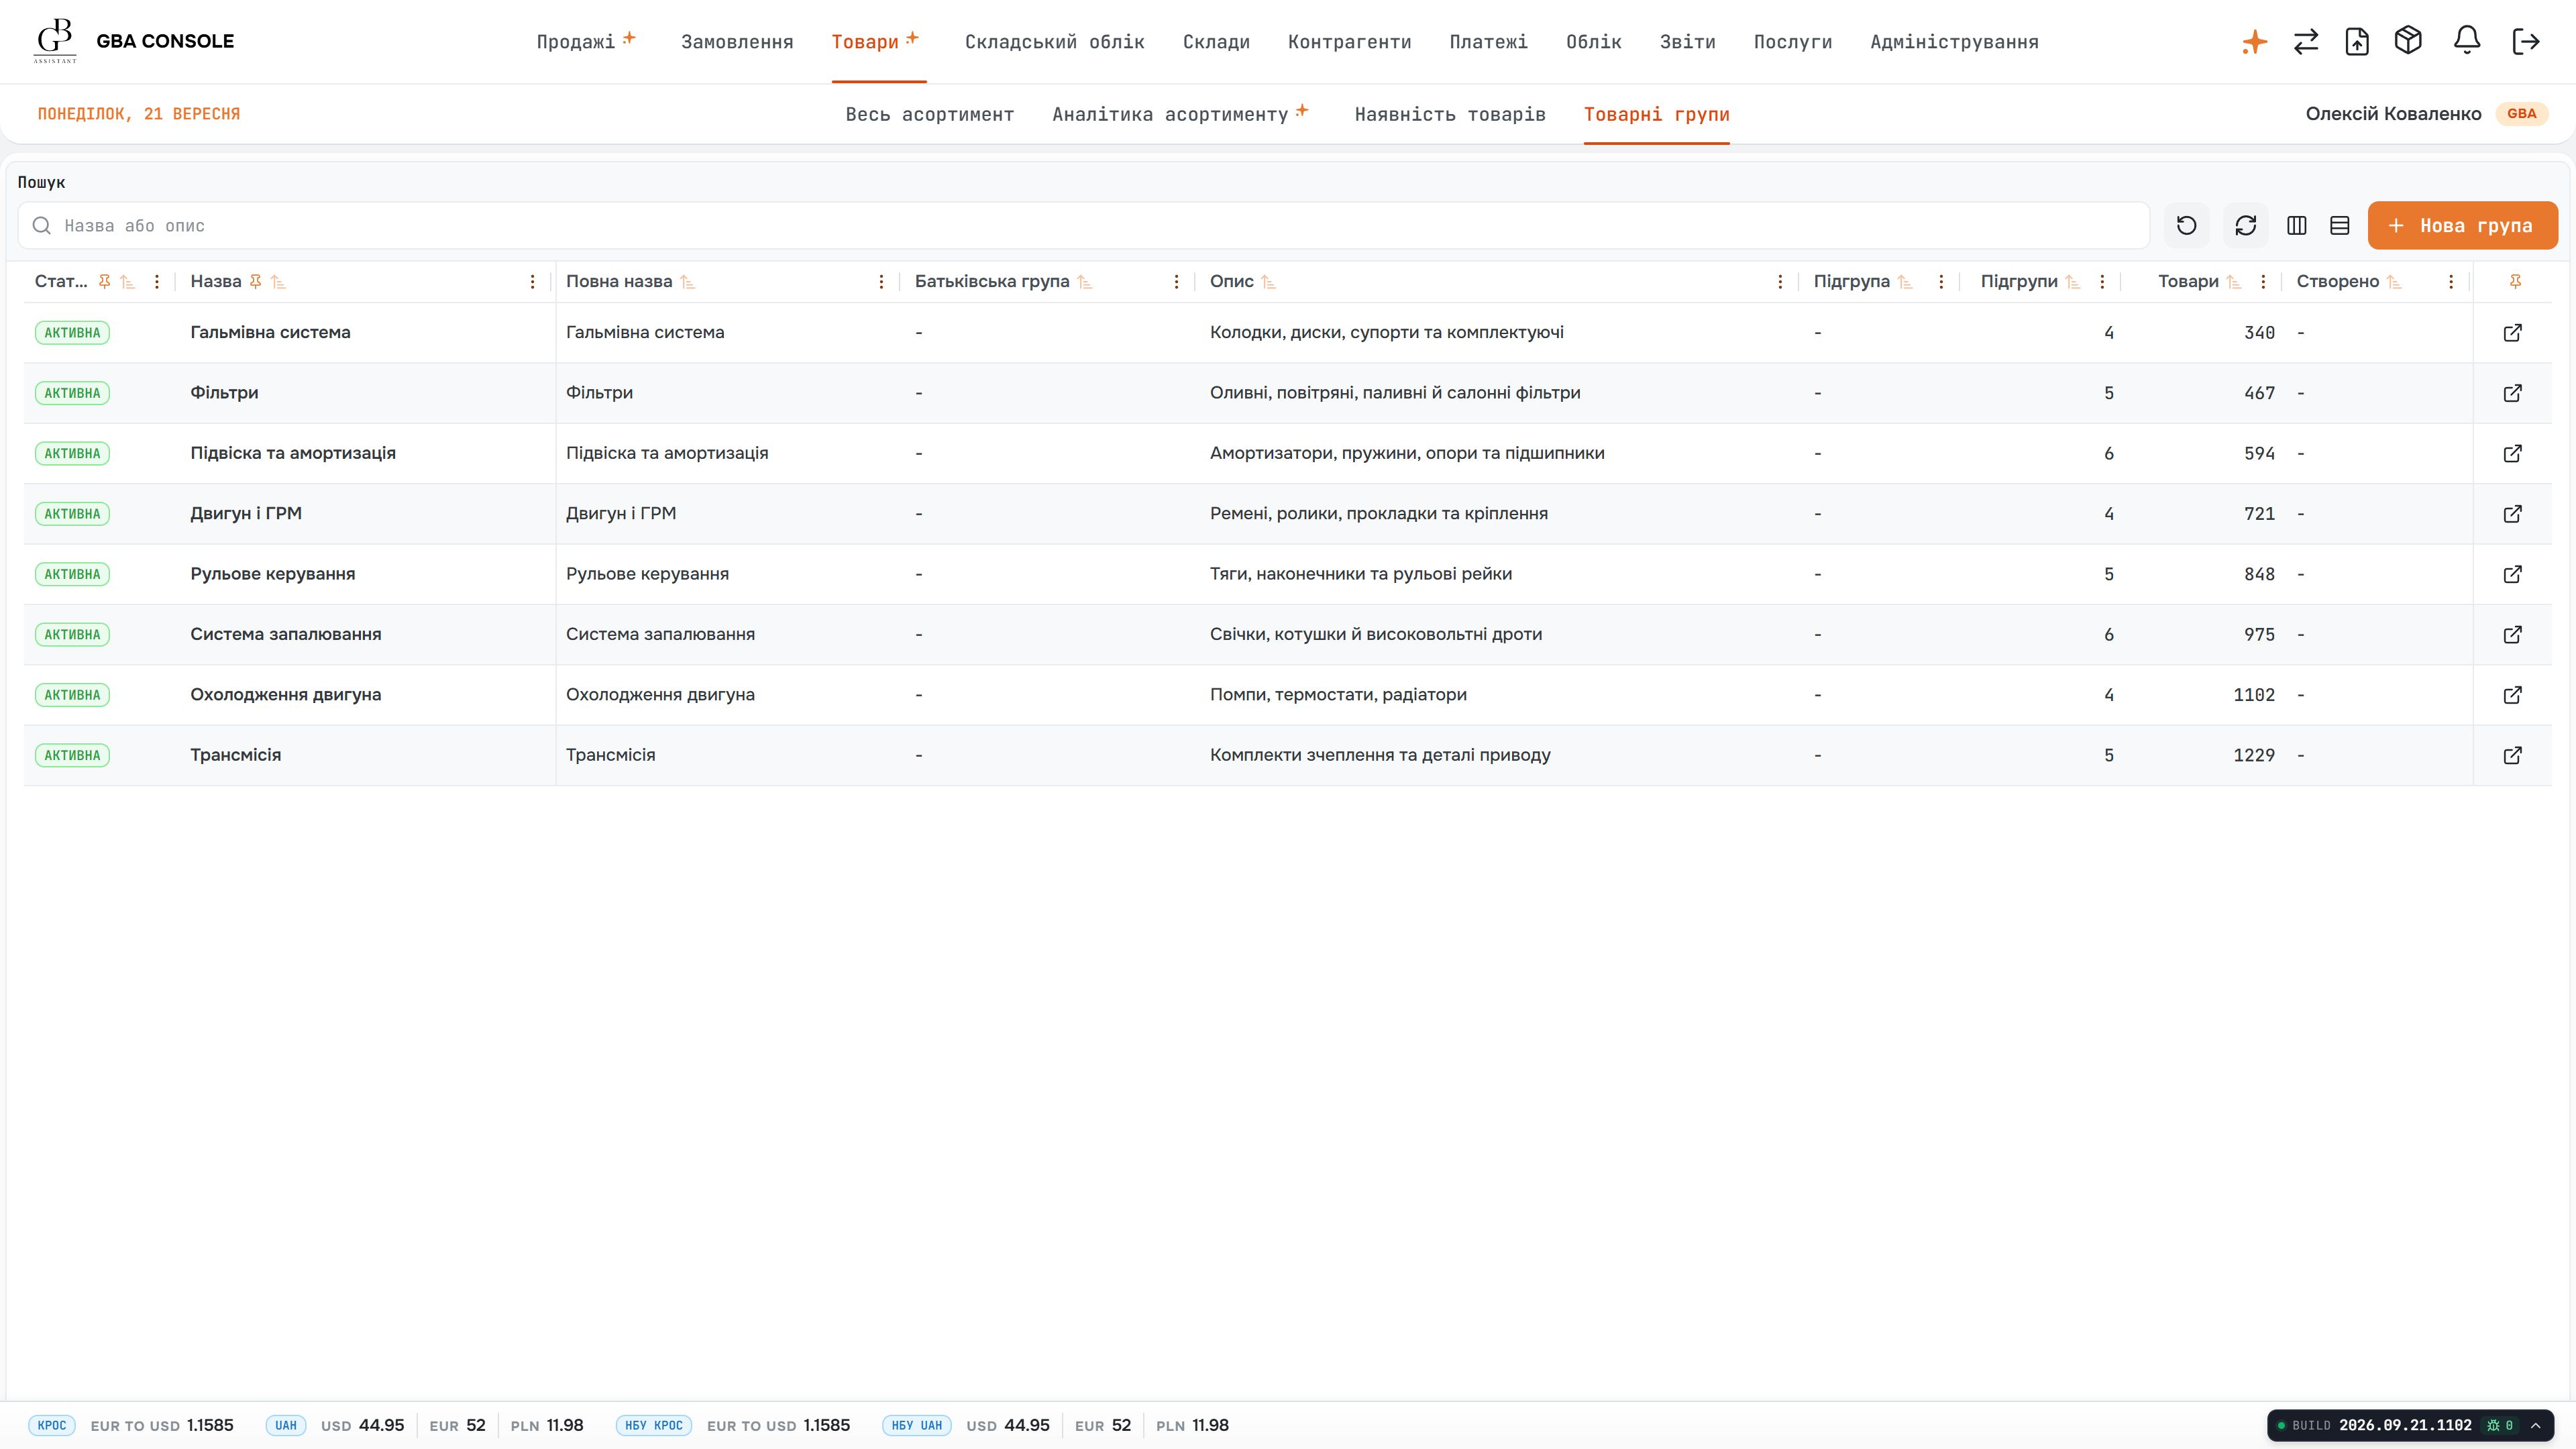
Product groups give the catalogue a maintained structure. Names, descriptions, status and item counts make it clear how products are organised before the team works with stock or sales records.
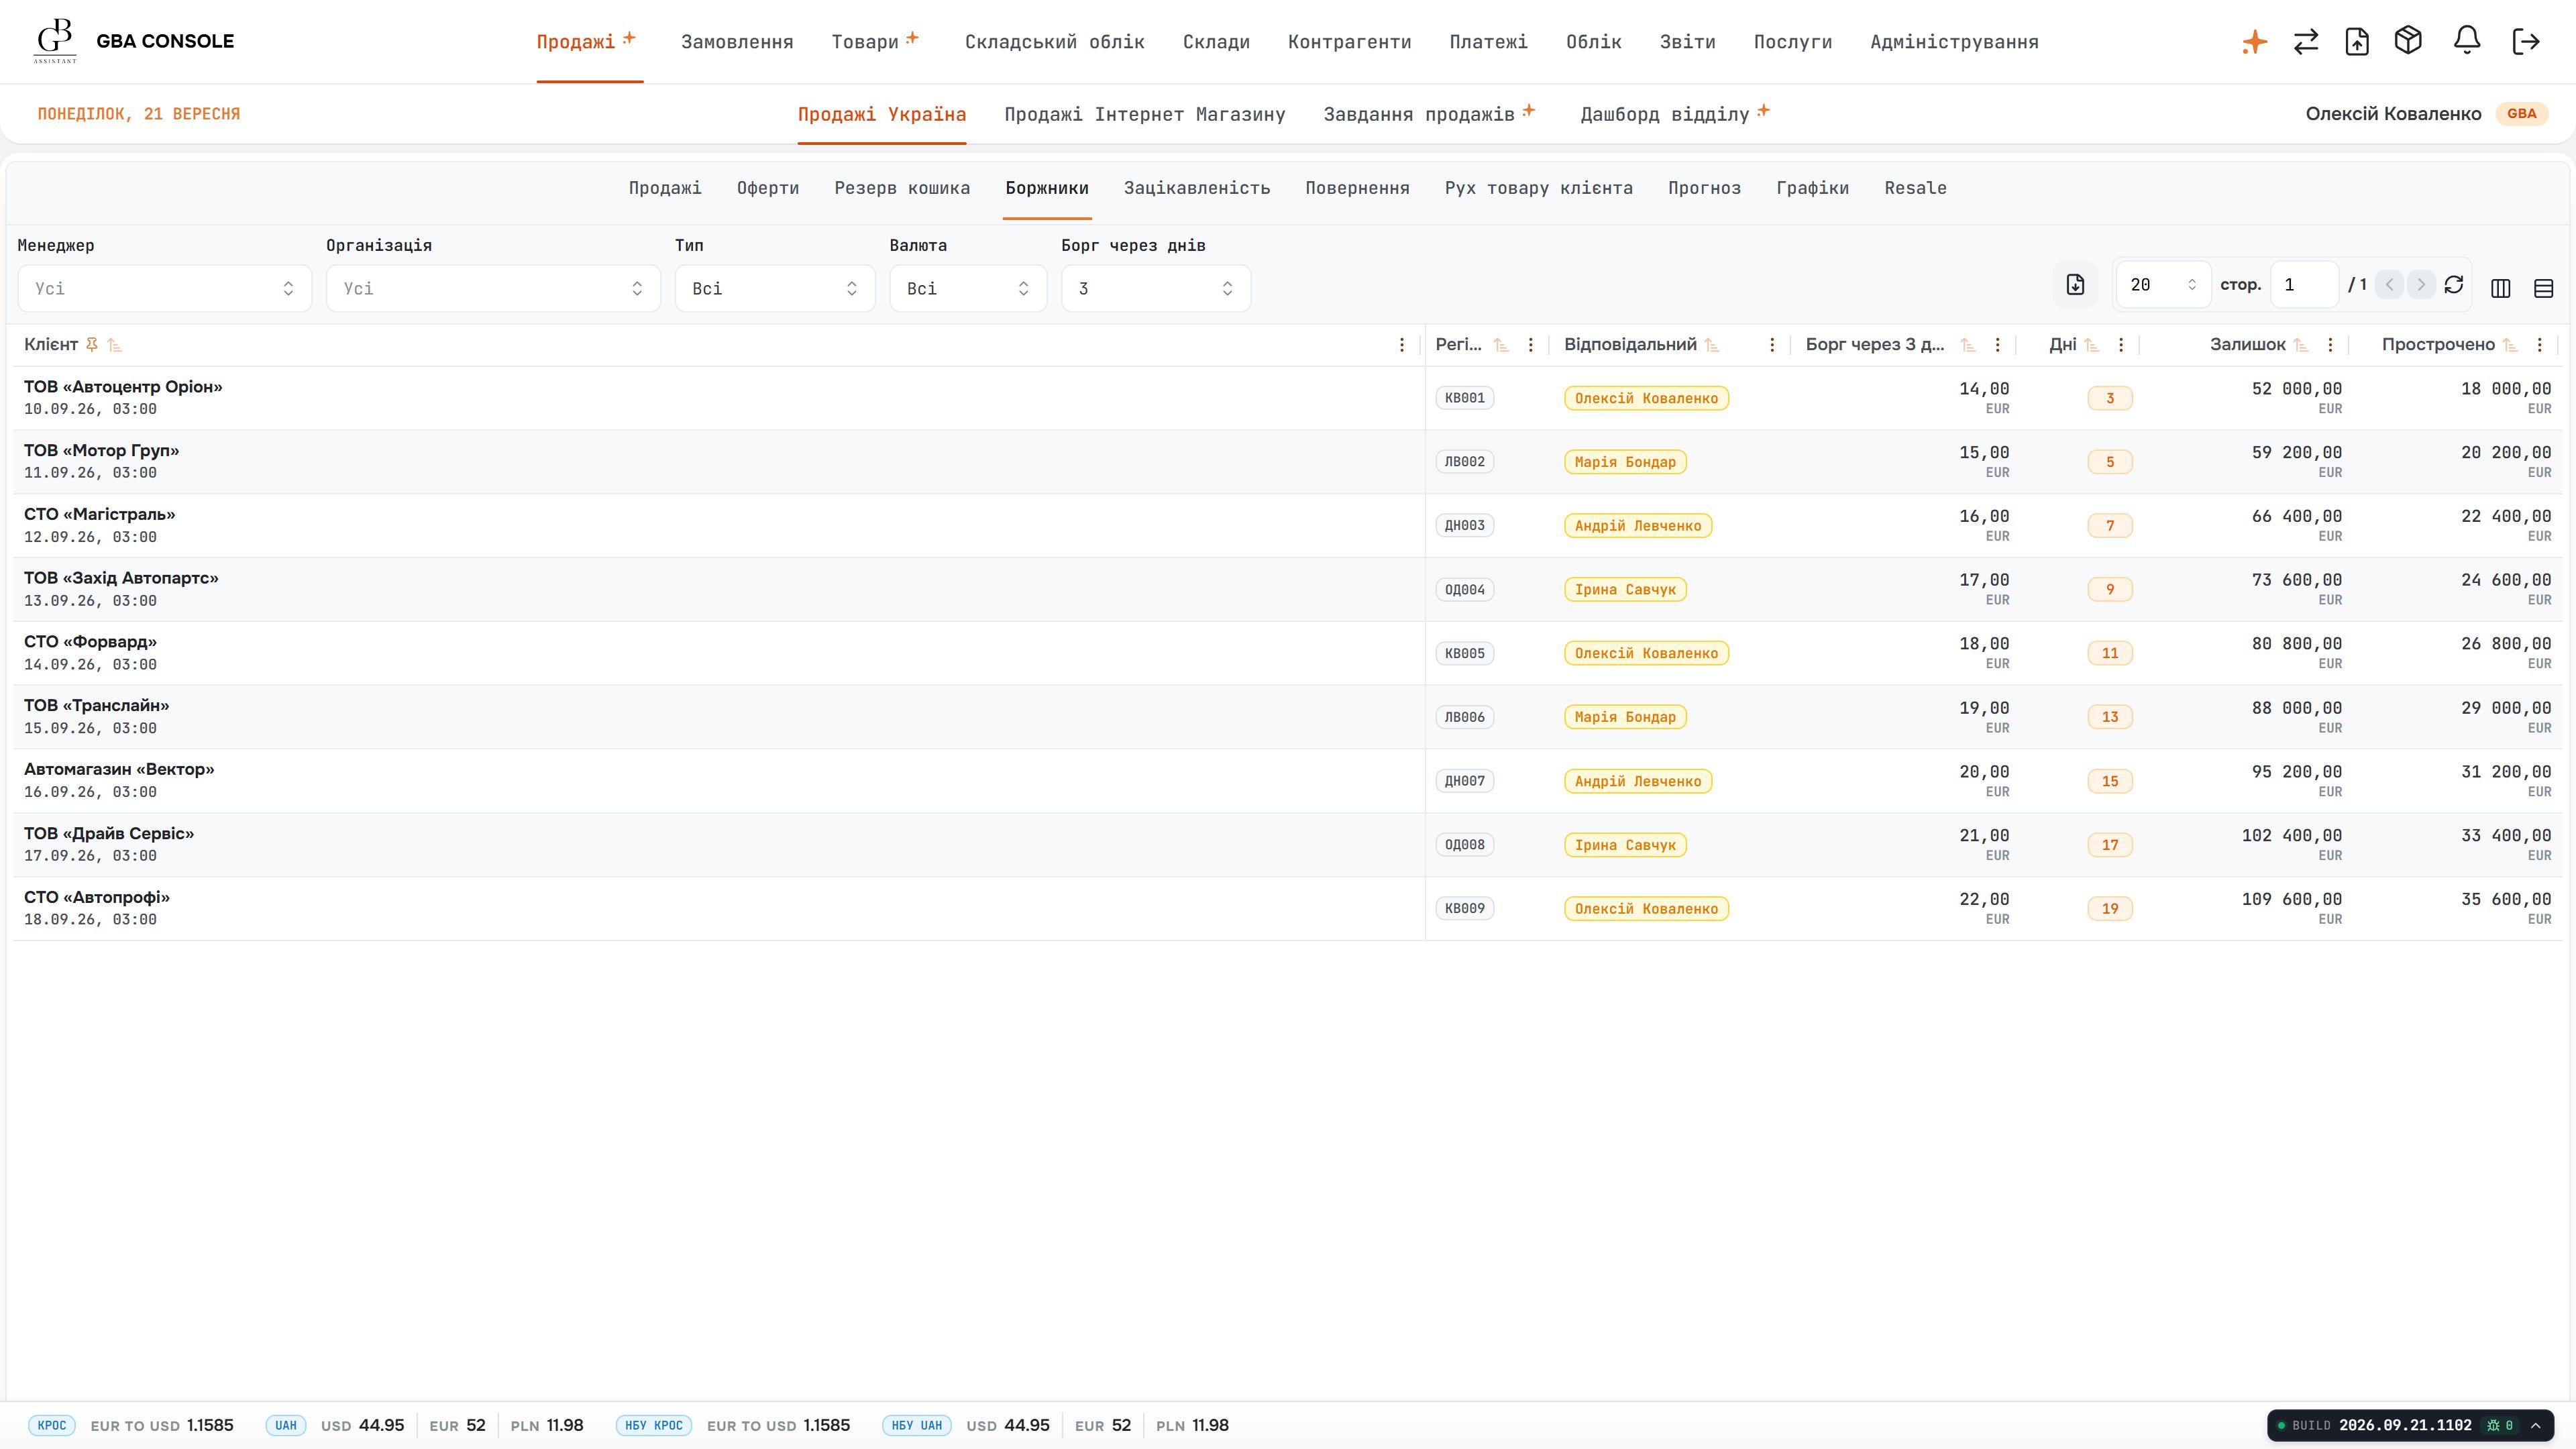
The debt view ties an overdue amount to the customer, payment terms and responsible manager. Collection work can start from the account that needs attention and the person who owns the relationship.
A sales amount alone does not explain whether an account is settled. Finance needs to distinguish the customer’s debt from individual receipts and check the currency, account and contract for each payment.
The debtor register gives a customer-level view with a responsible manager and payment terms. Incoming cash records provide the document-level detail needed to inspect the counterparty, amount and settlement context.
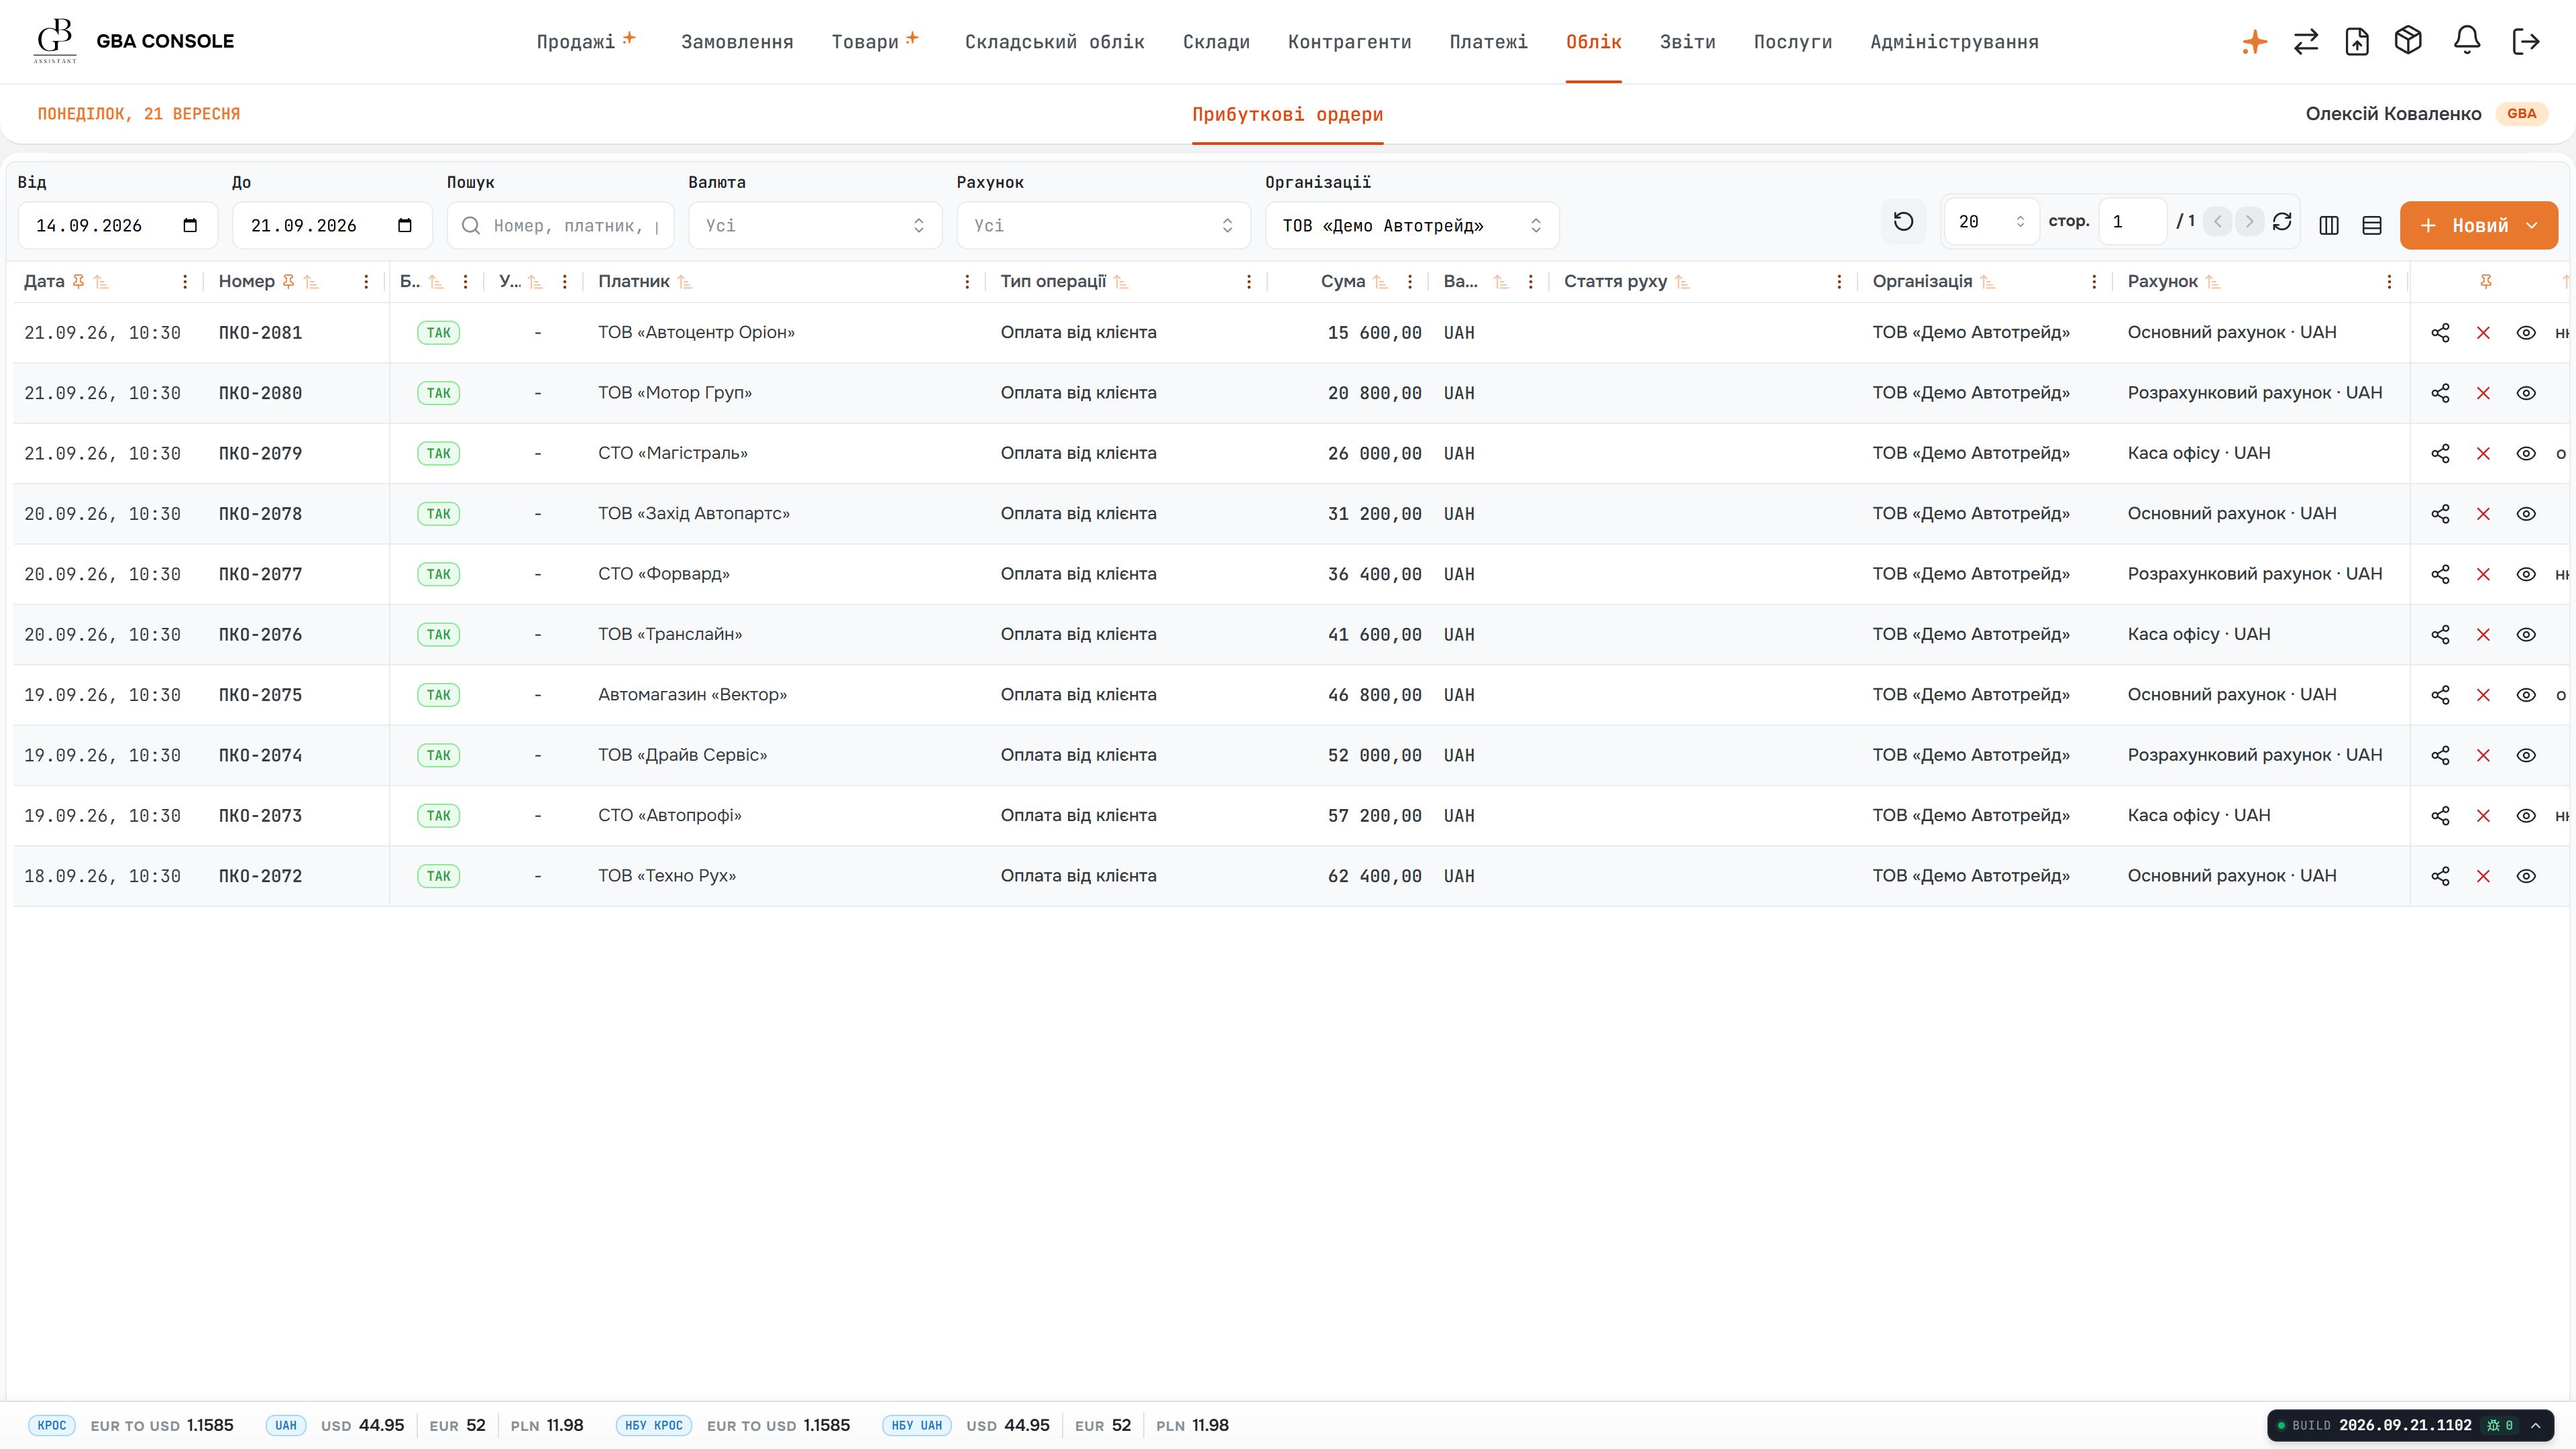
The incoming-payment register separates receipts by operation, counterparty, currency and account. Finance can find the relevant record and inspect its details when checking a customer’s balance.
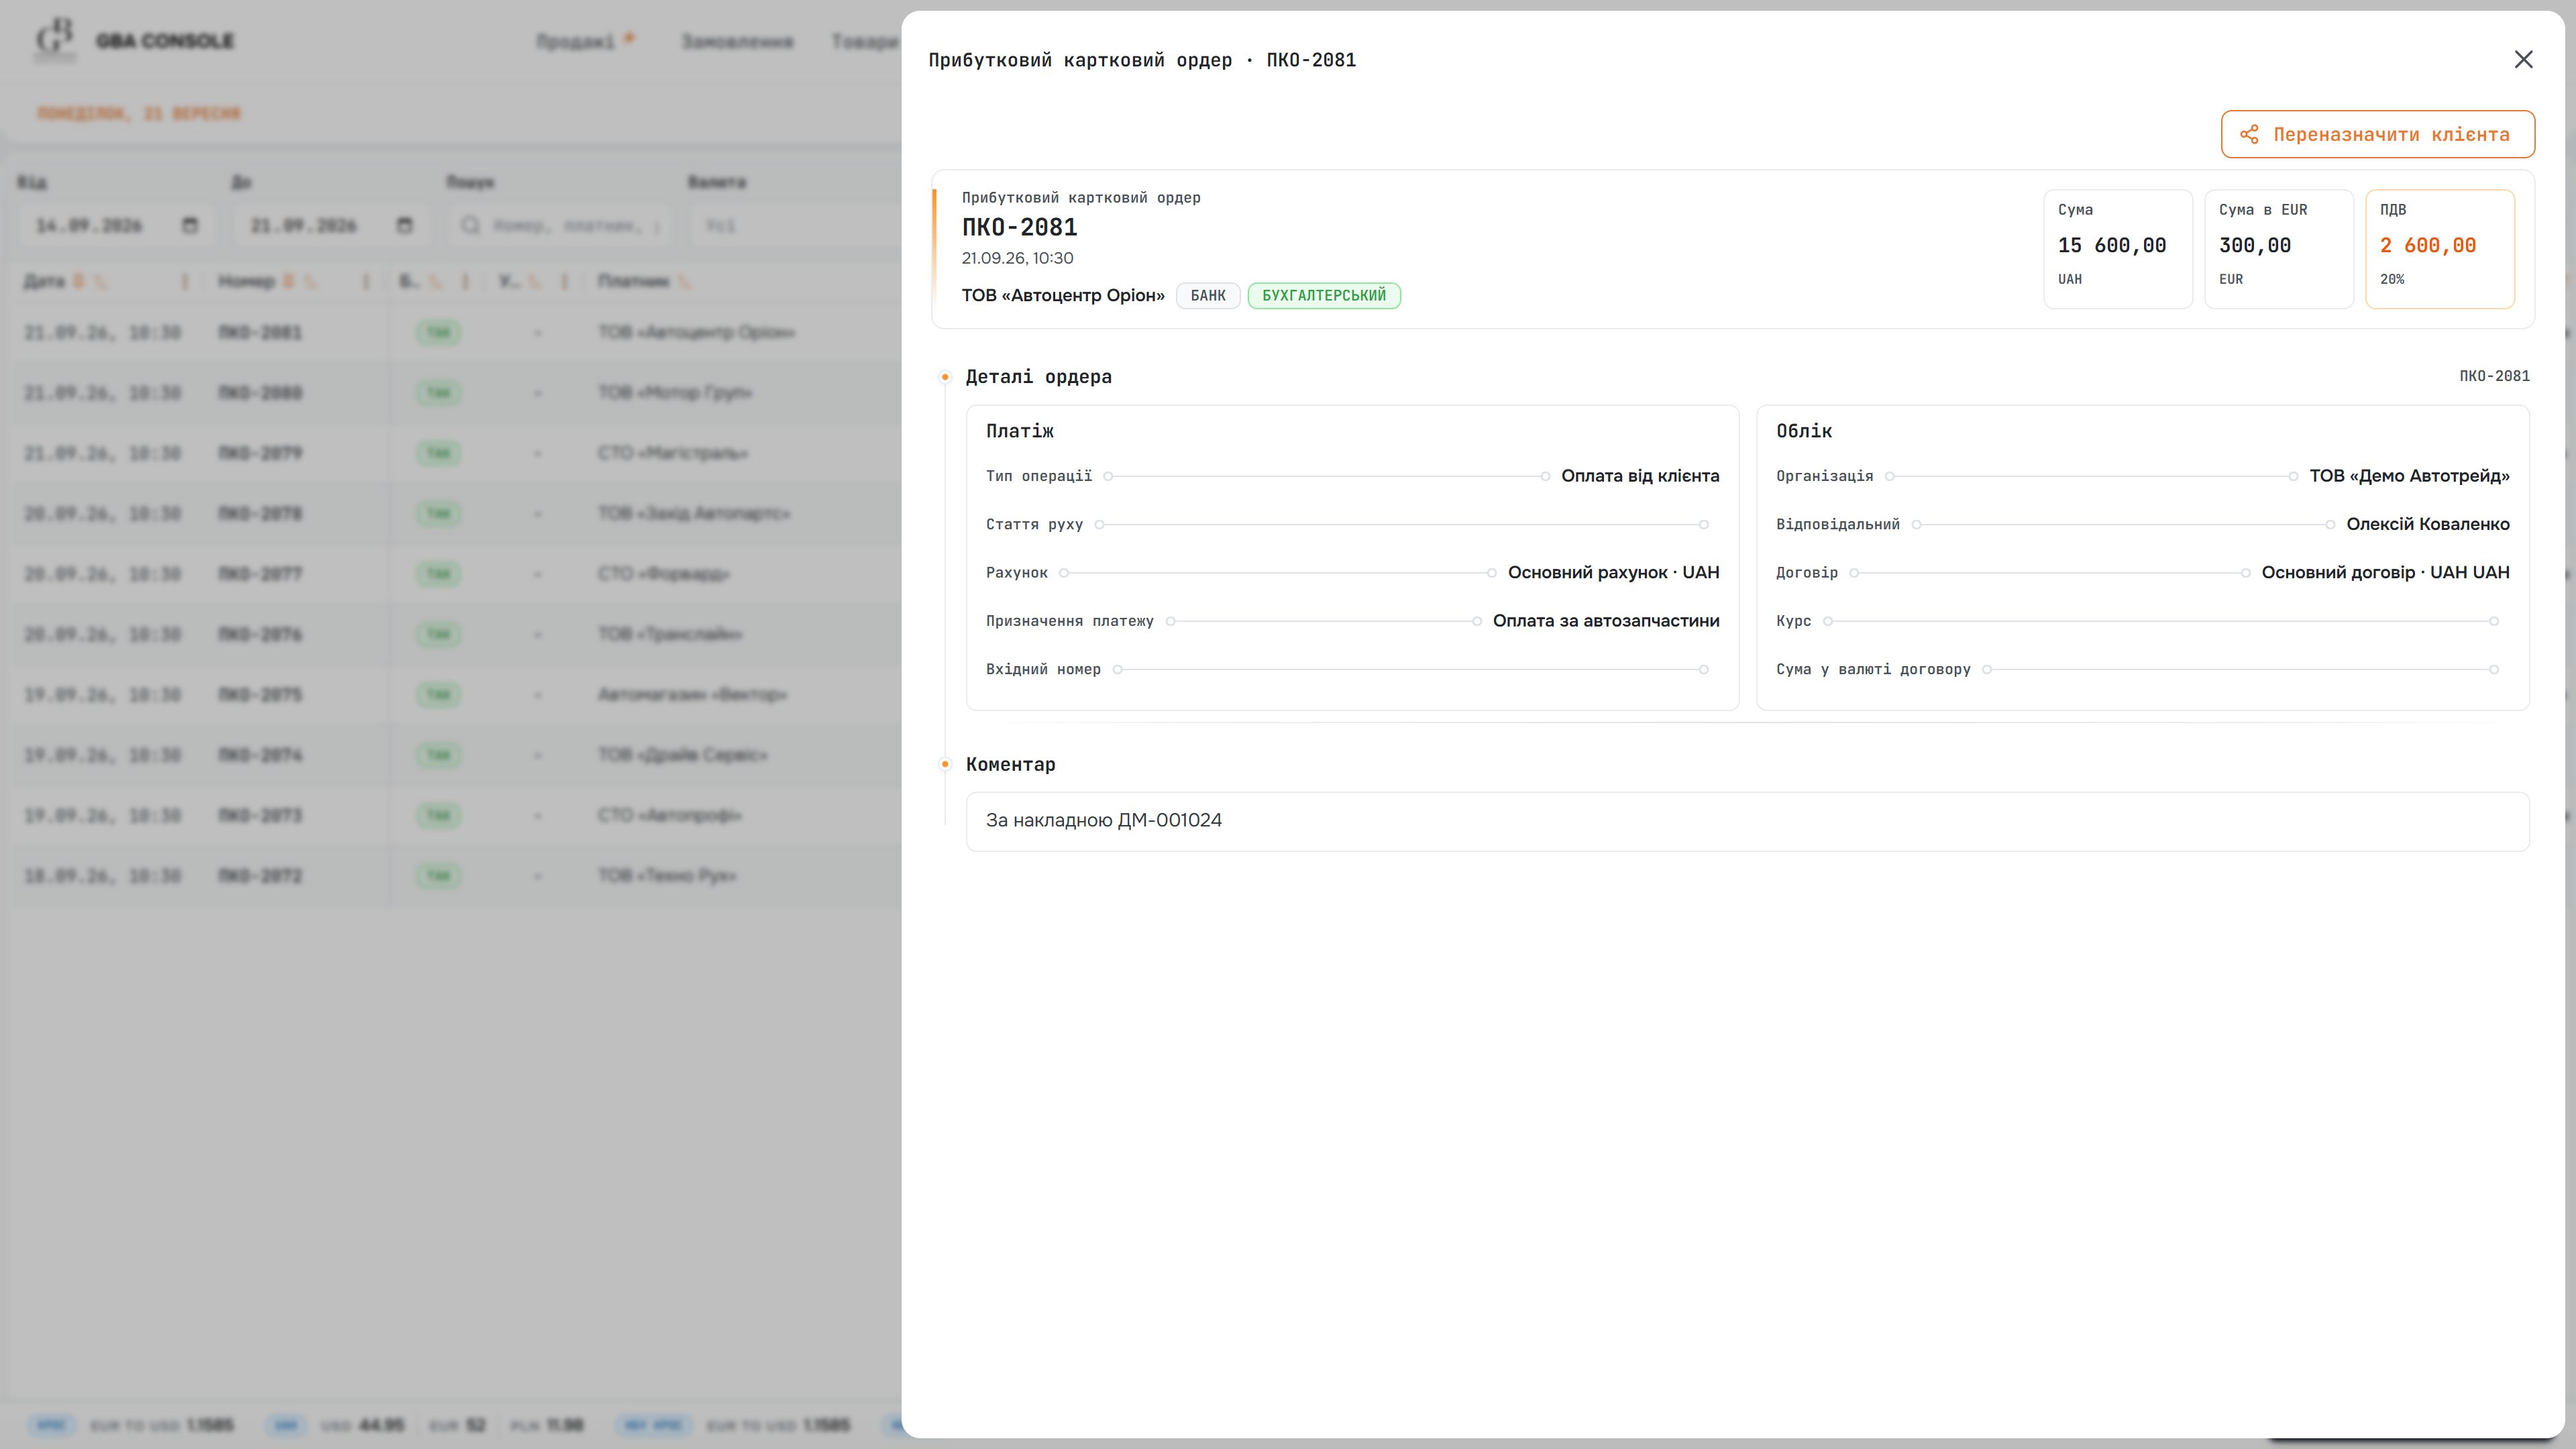
Opening a receipt reveals the operation type, contract, accounts and comment behind the amount. The document provides the context needed to reconcile the entry with the customer’s commercial records.
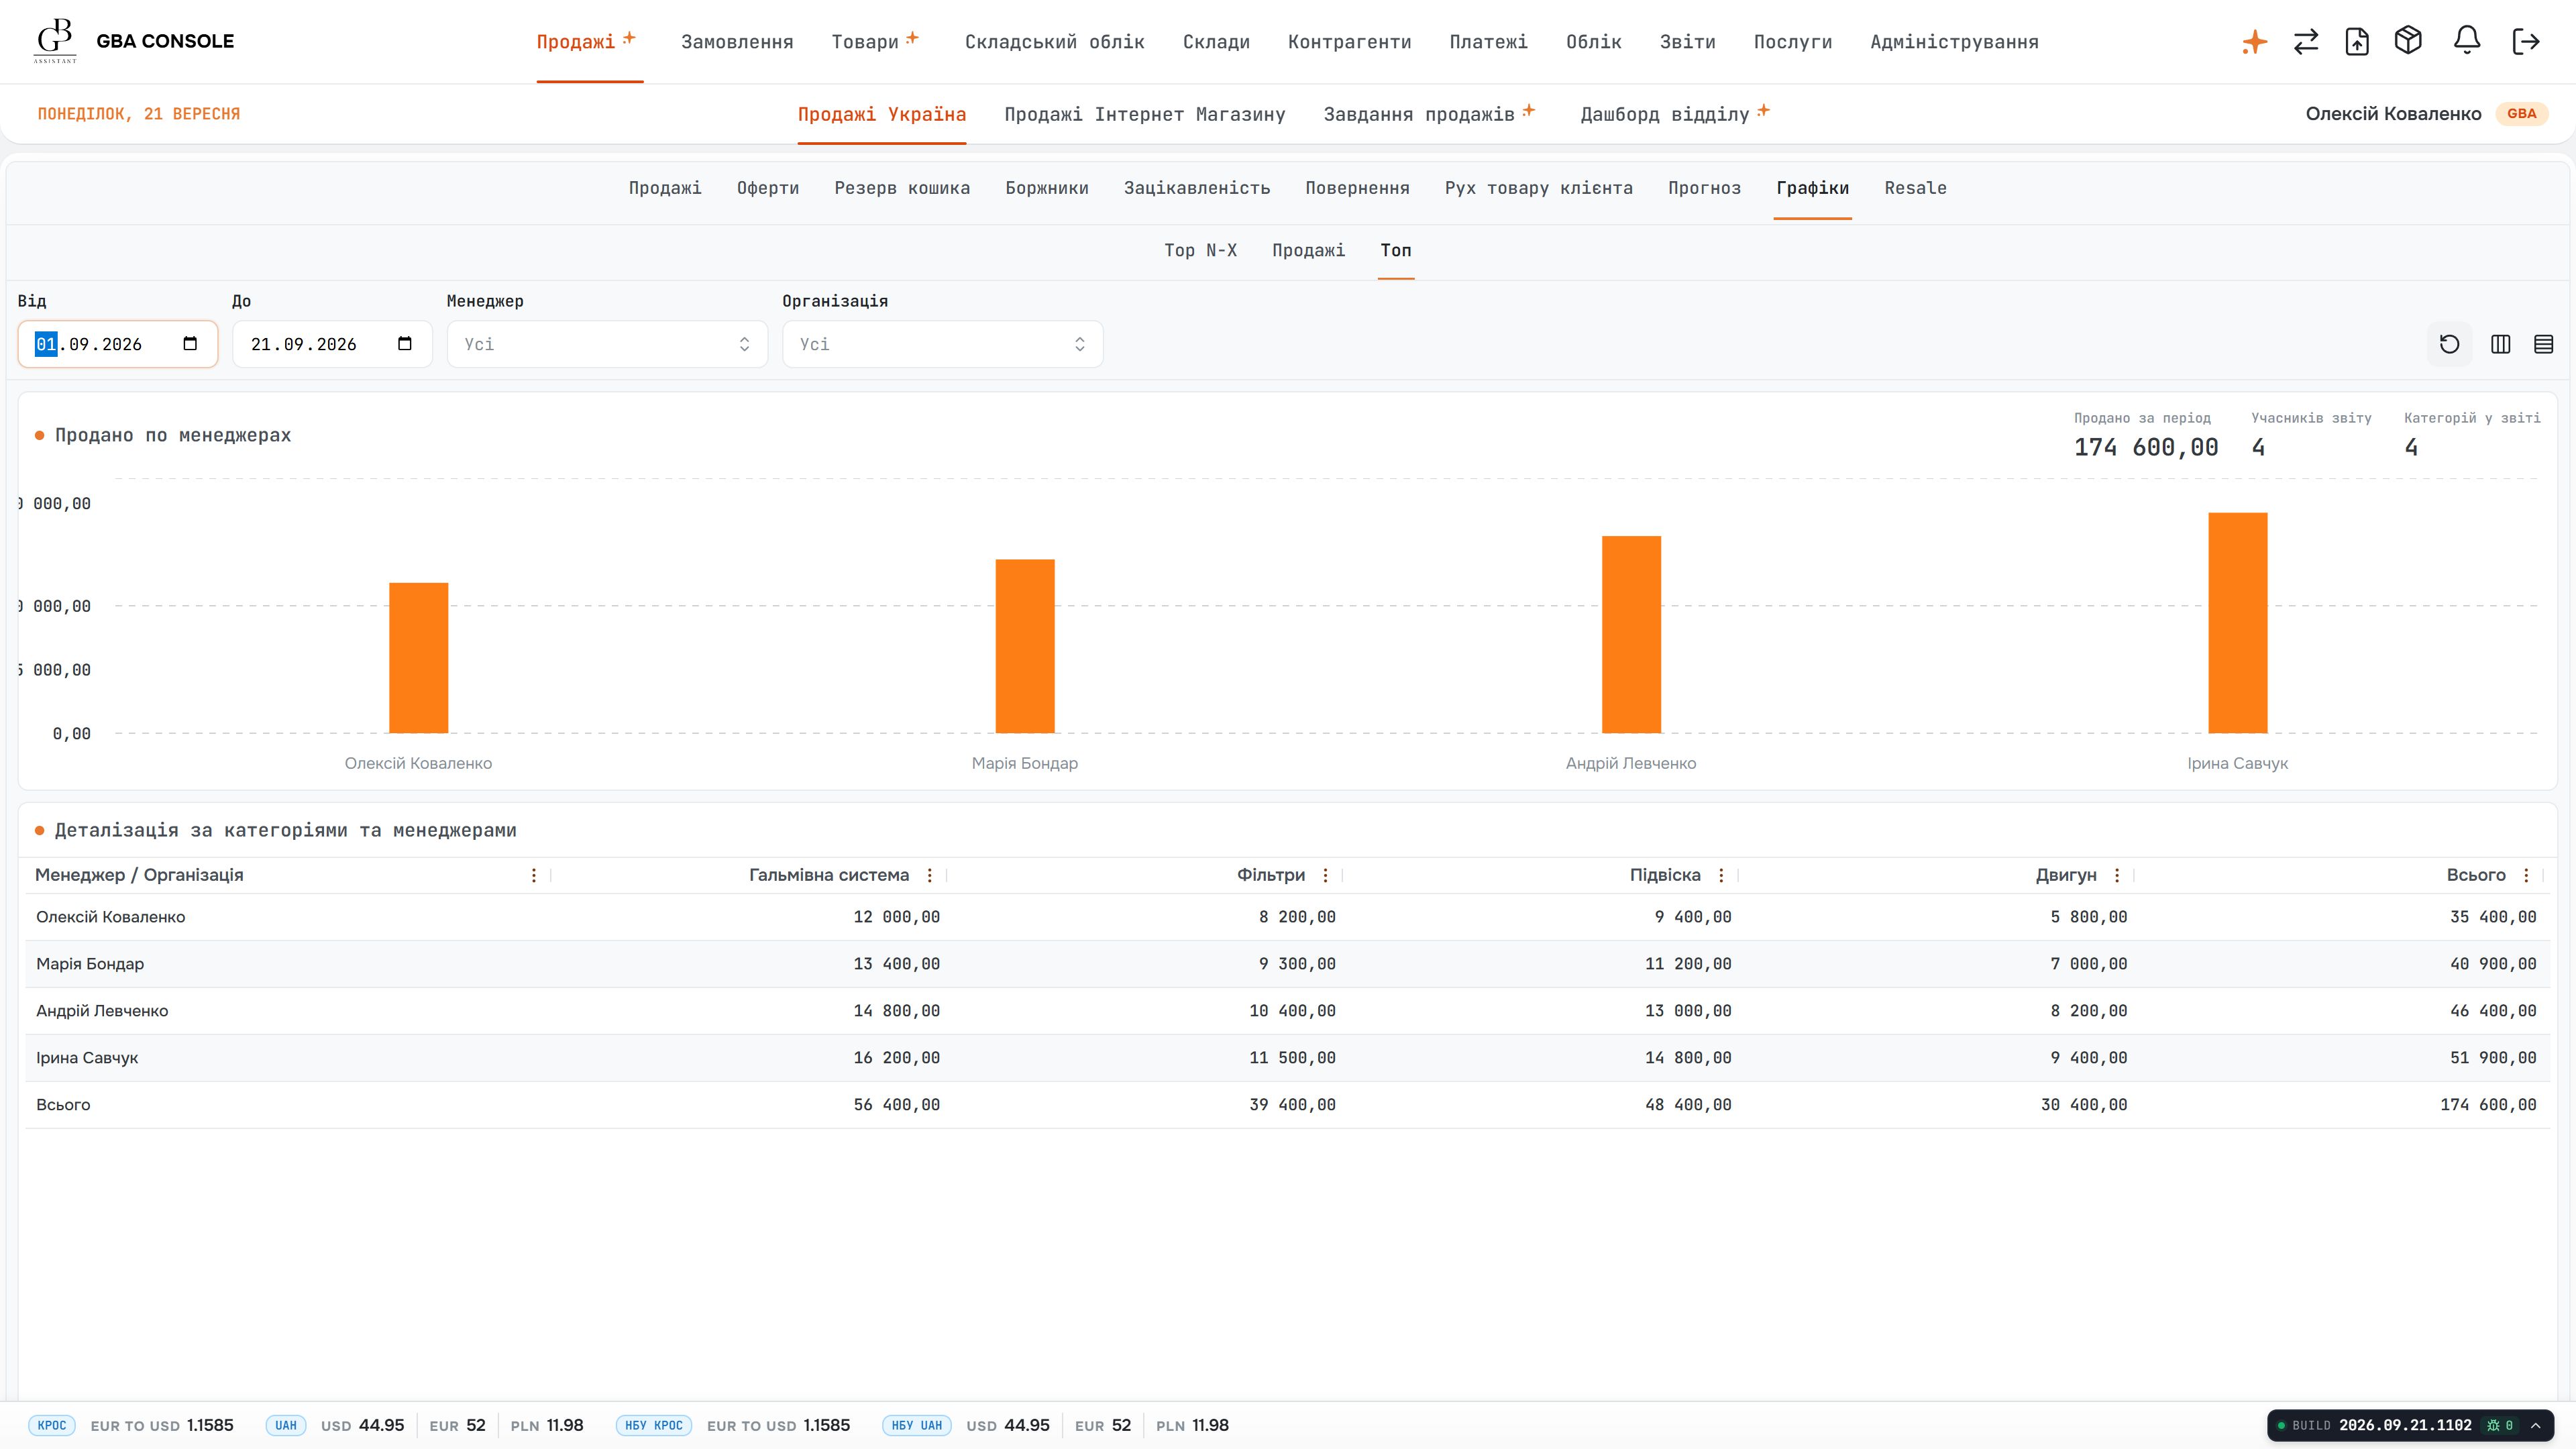
Sales analysis connects the selected period with managers and product categories. The chart gives an overview while the table exposes the category breakdown used to understand the composition of sales.
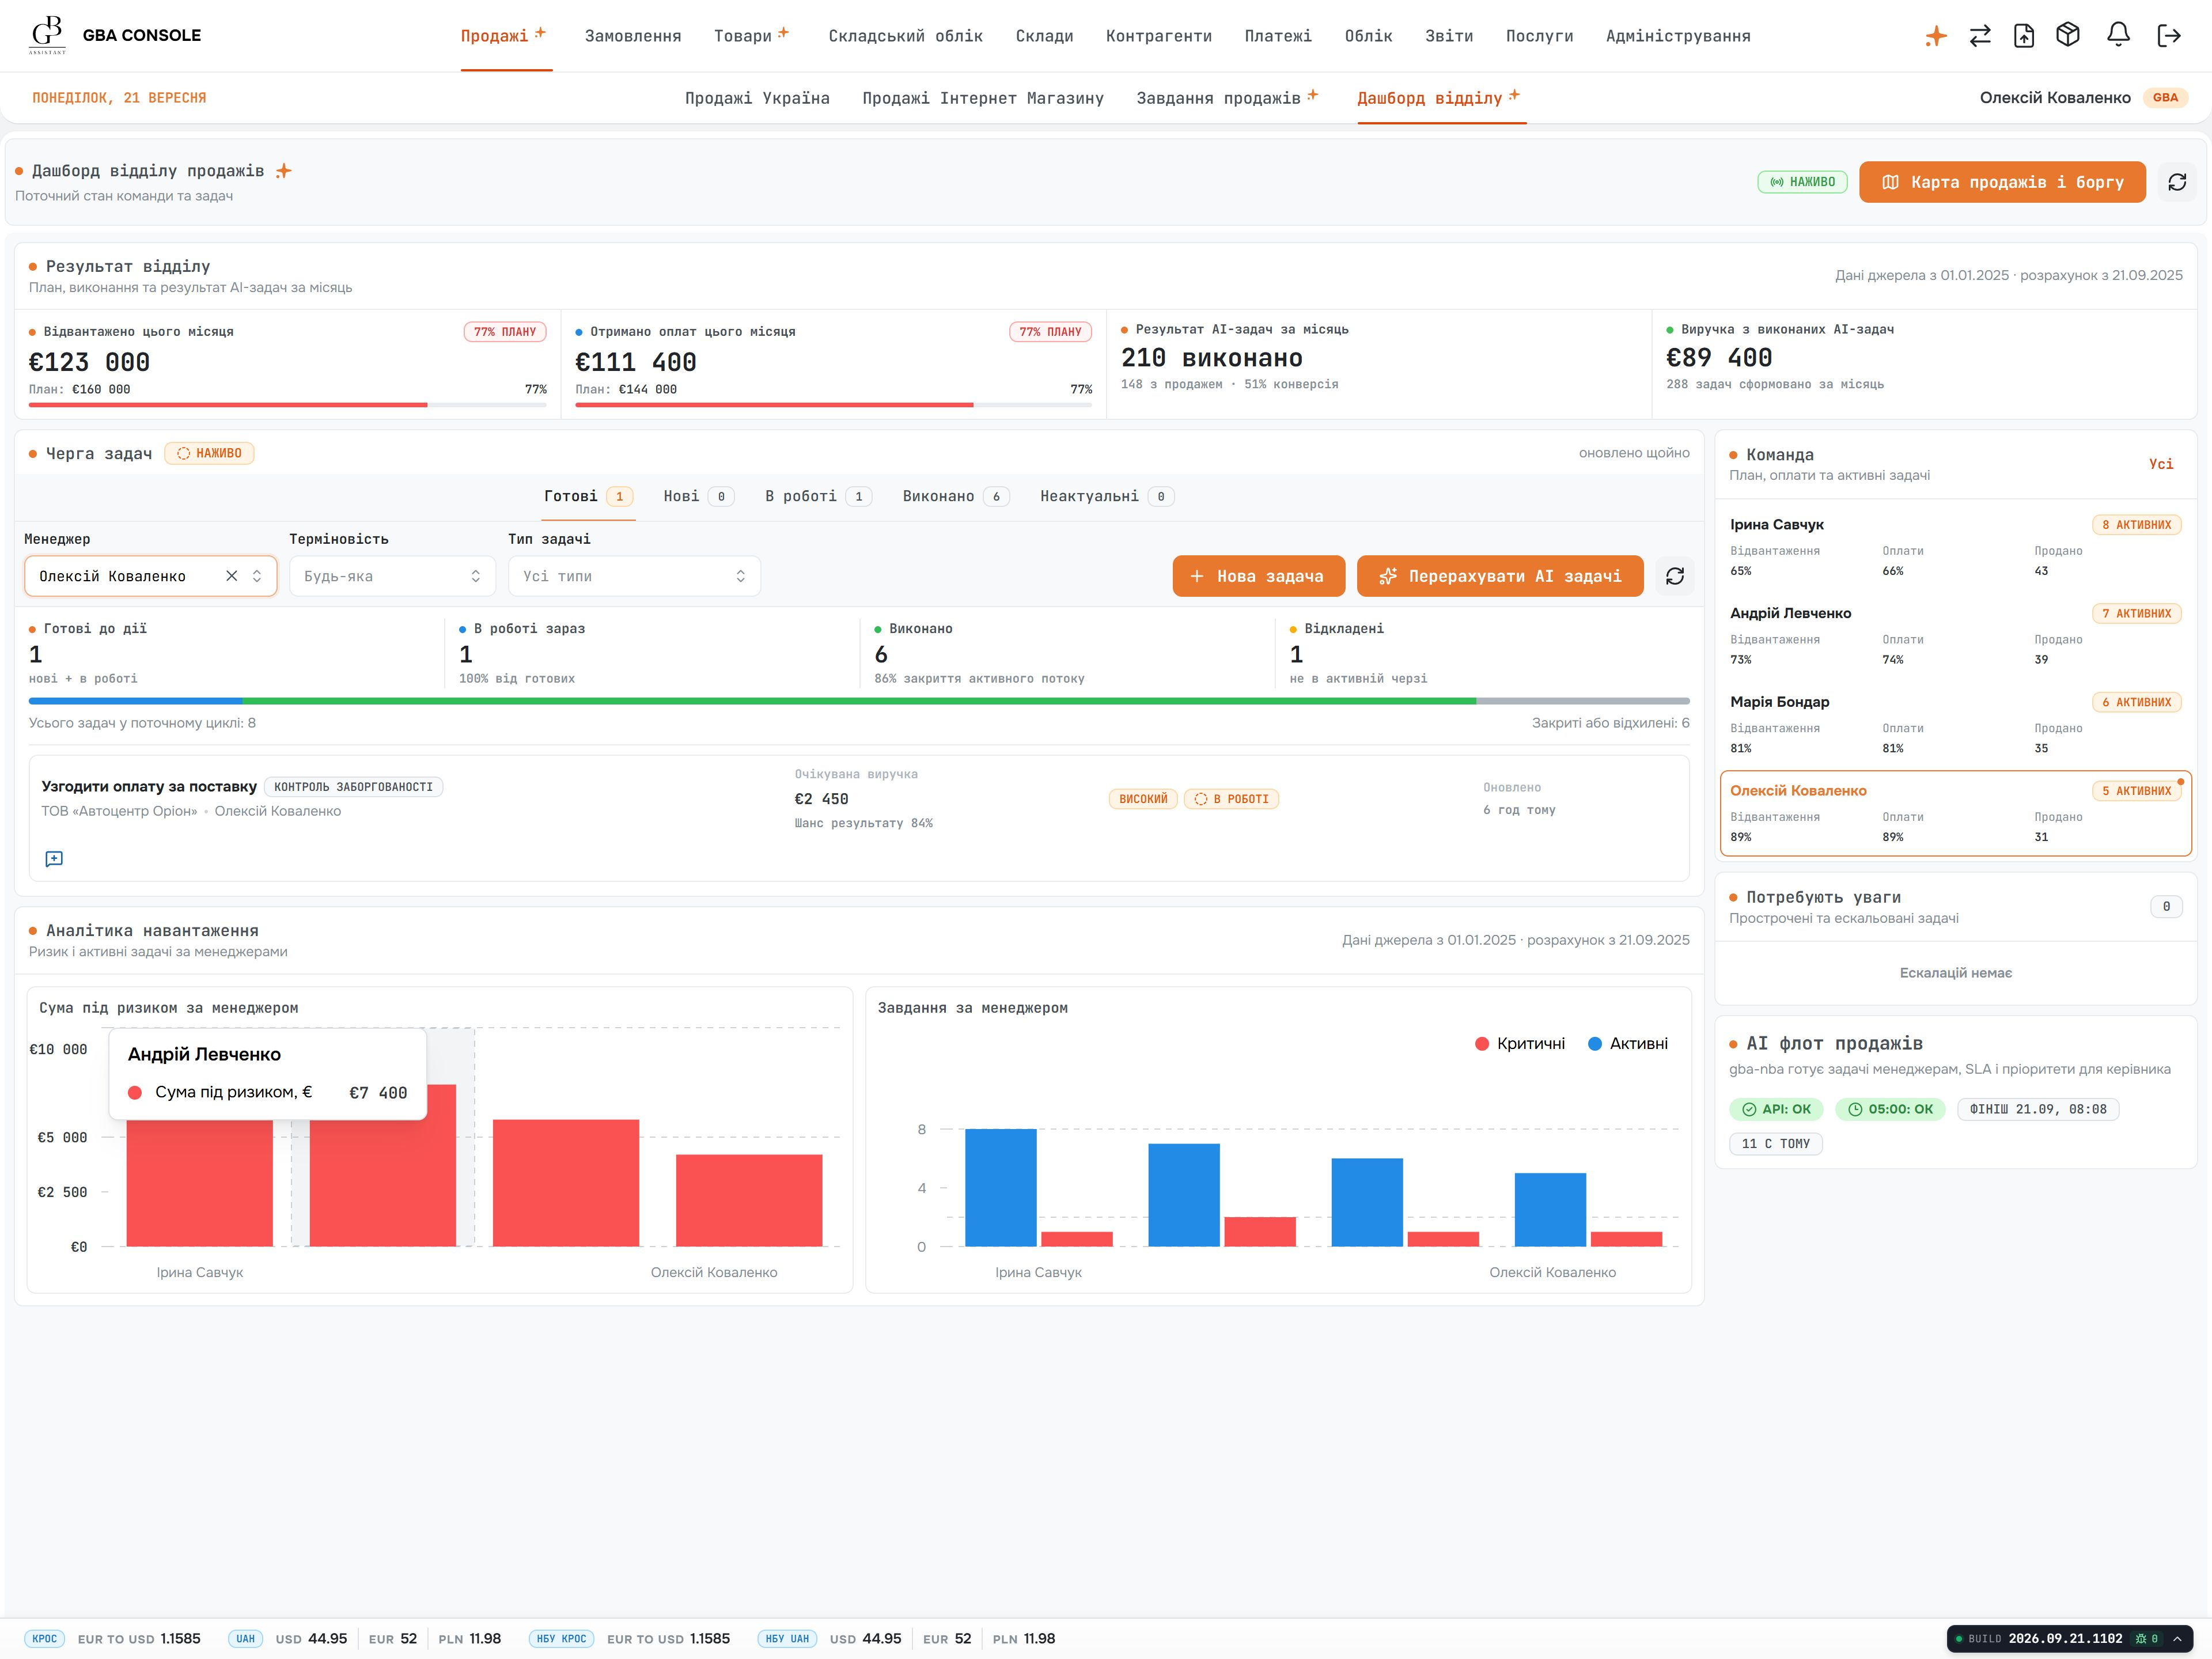
Department totals and an individual manager’s workload answer different questions. Leaders need both views to identify outstanding work and understand which customers and tasks require attention.
The department dashboard combines performance cards, a task queue and workload charts. Filtering by manager narrows the same review to one person, while team administration keeps membership and assigned roles explicit.
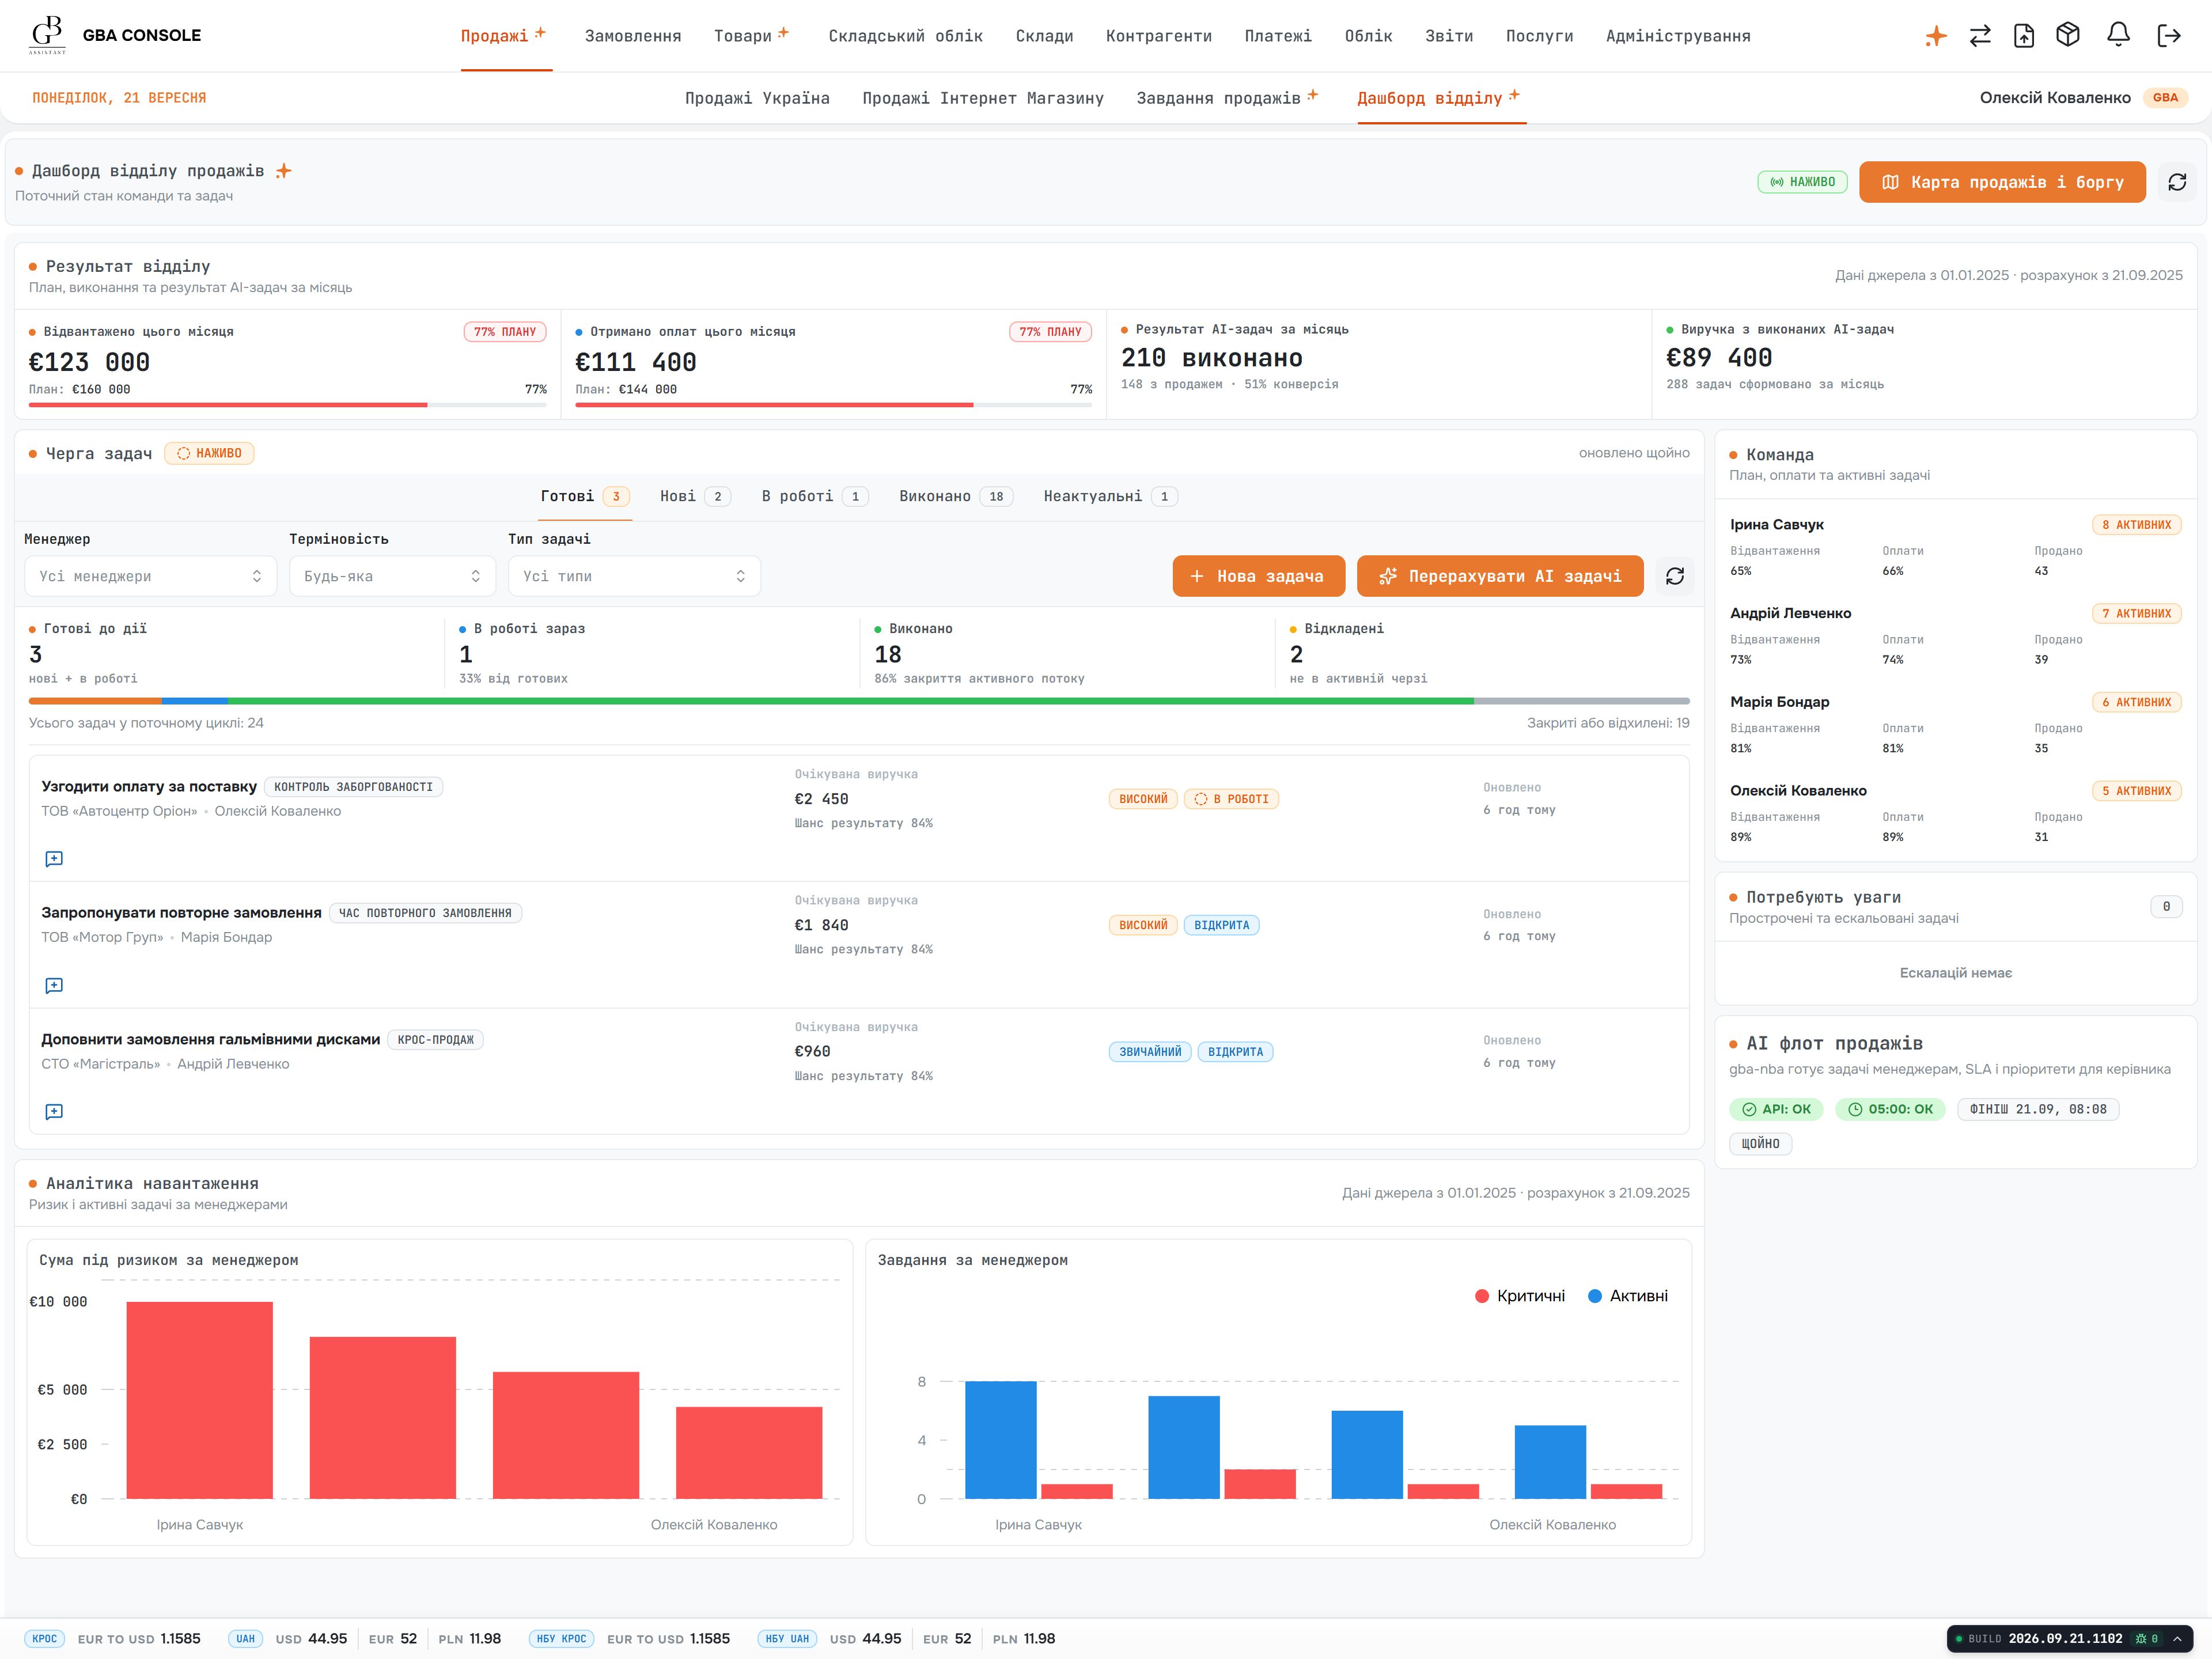
The department dashboard brings shipment and payment progress alongside queued tasks and workload. The manager list connects the overall picture to named people, making the review useful for deciding what requires attention next.
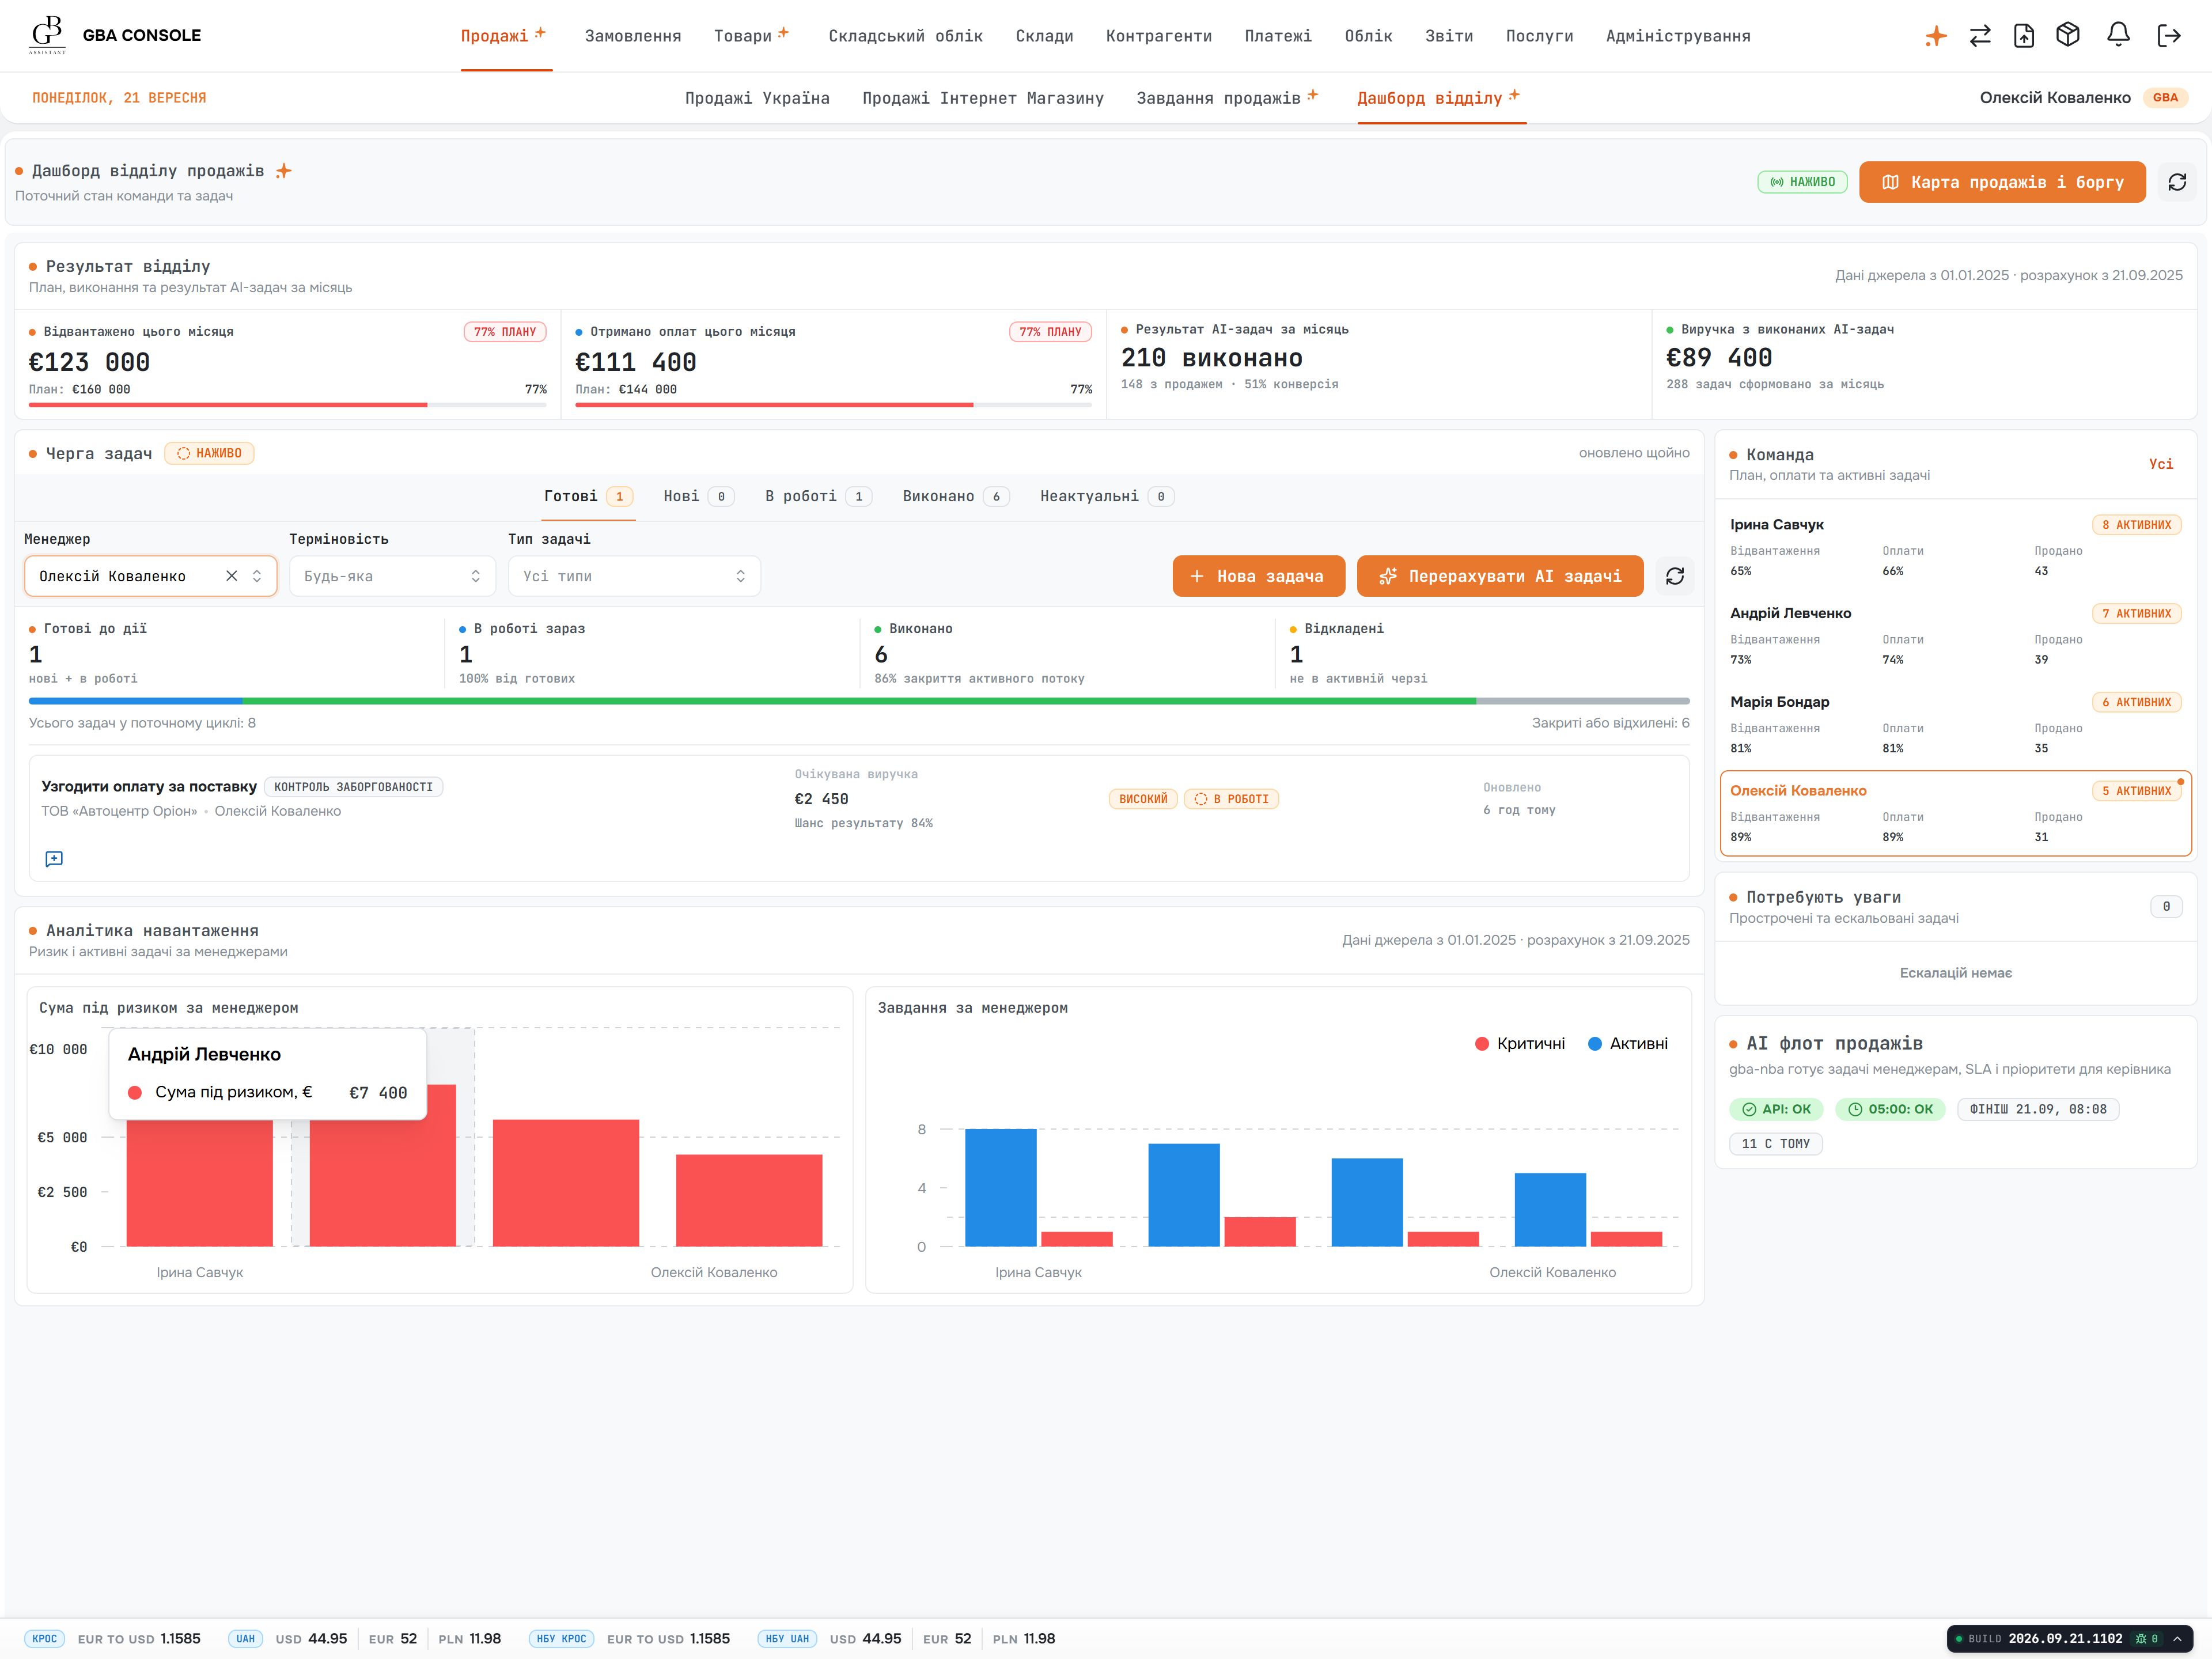
The manager filter keeps the dashboard’s structure while narrowing its tasks and charts to one person. Leaders can review individual workload without changing how the department’s performance is presented.
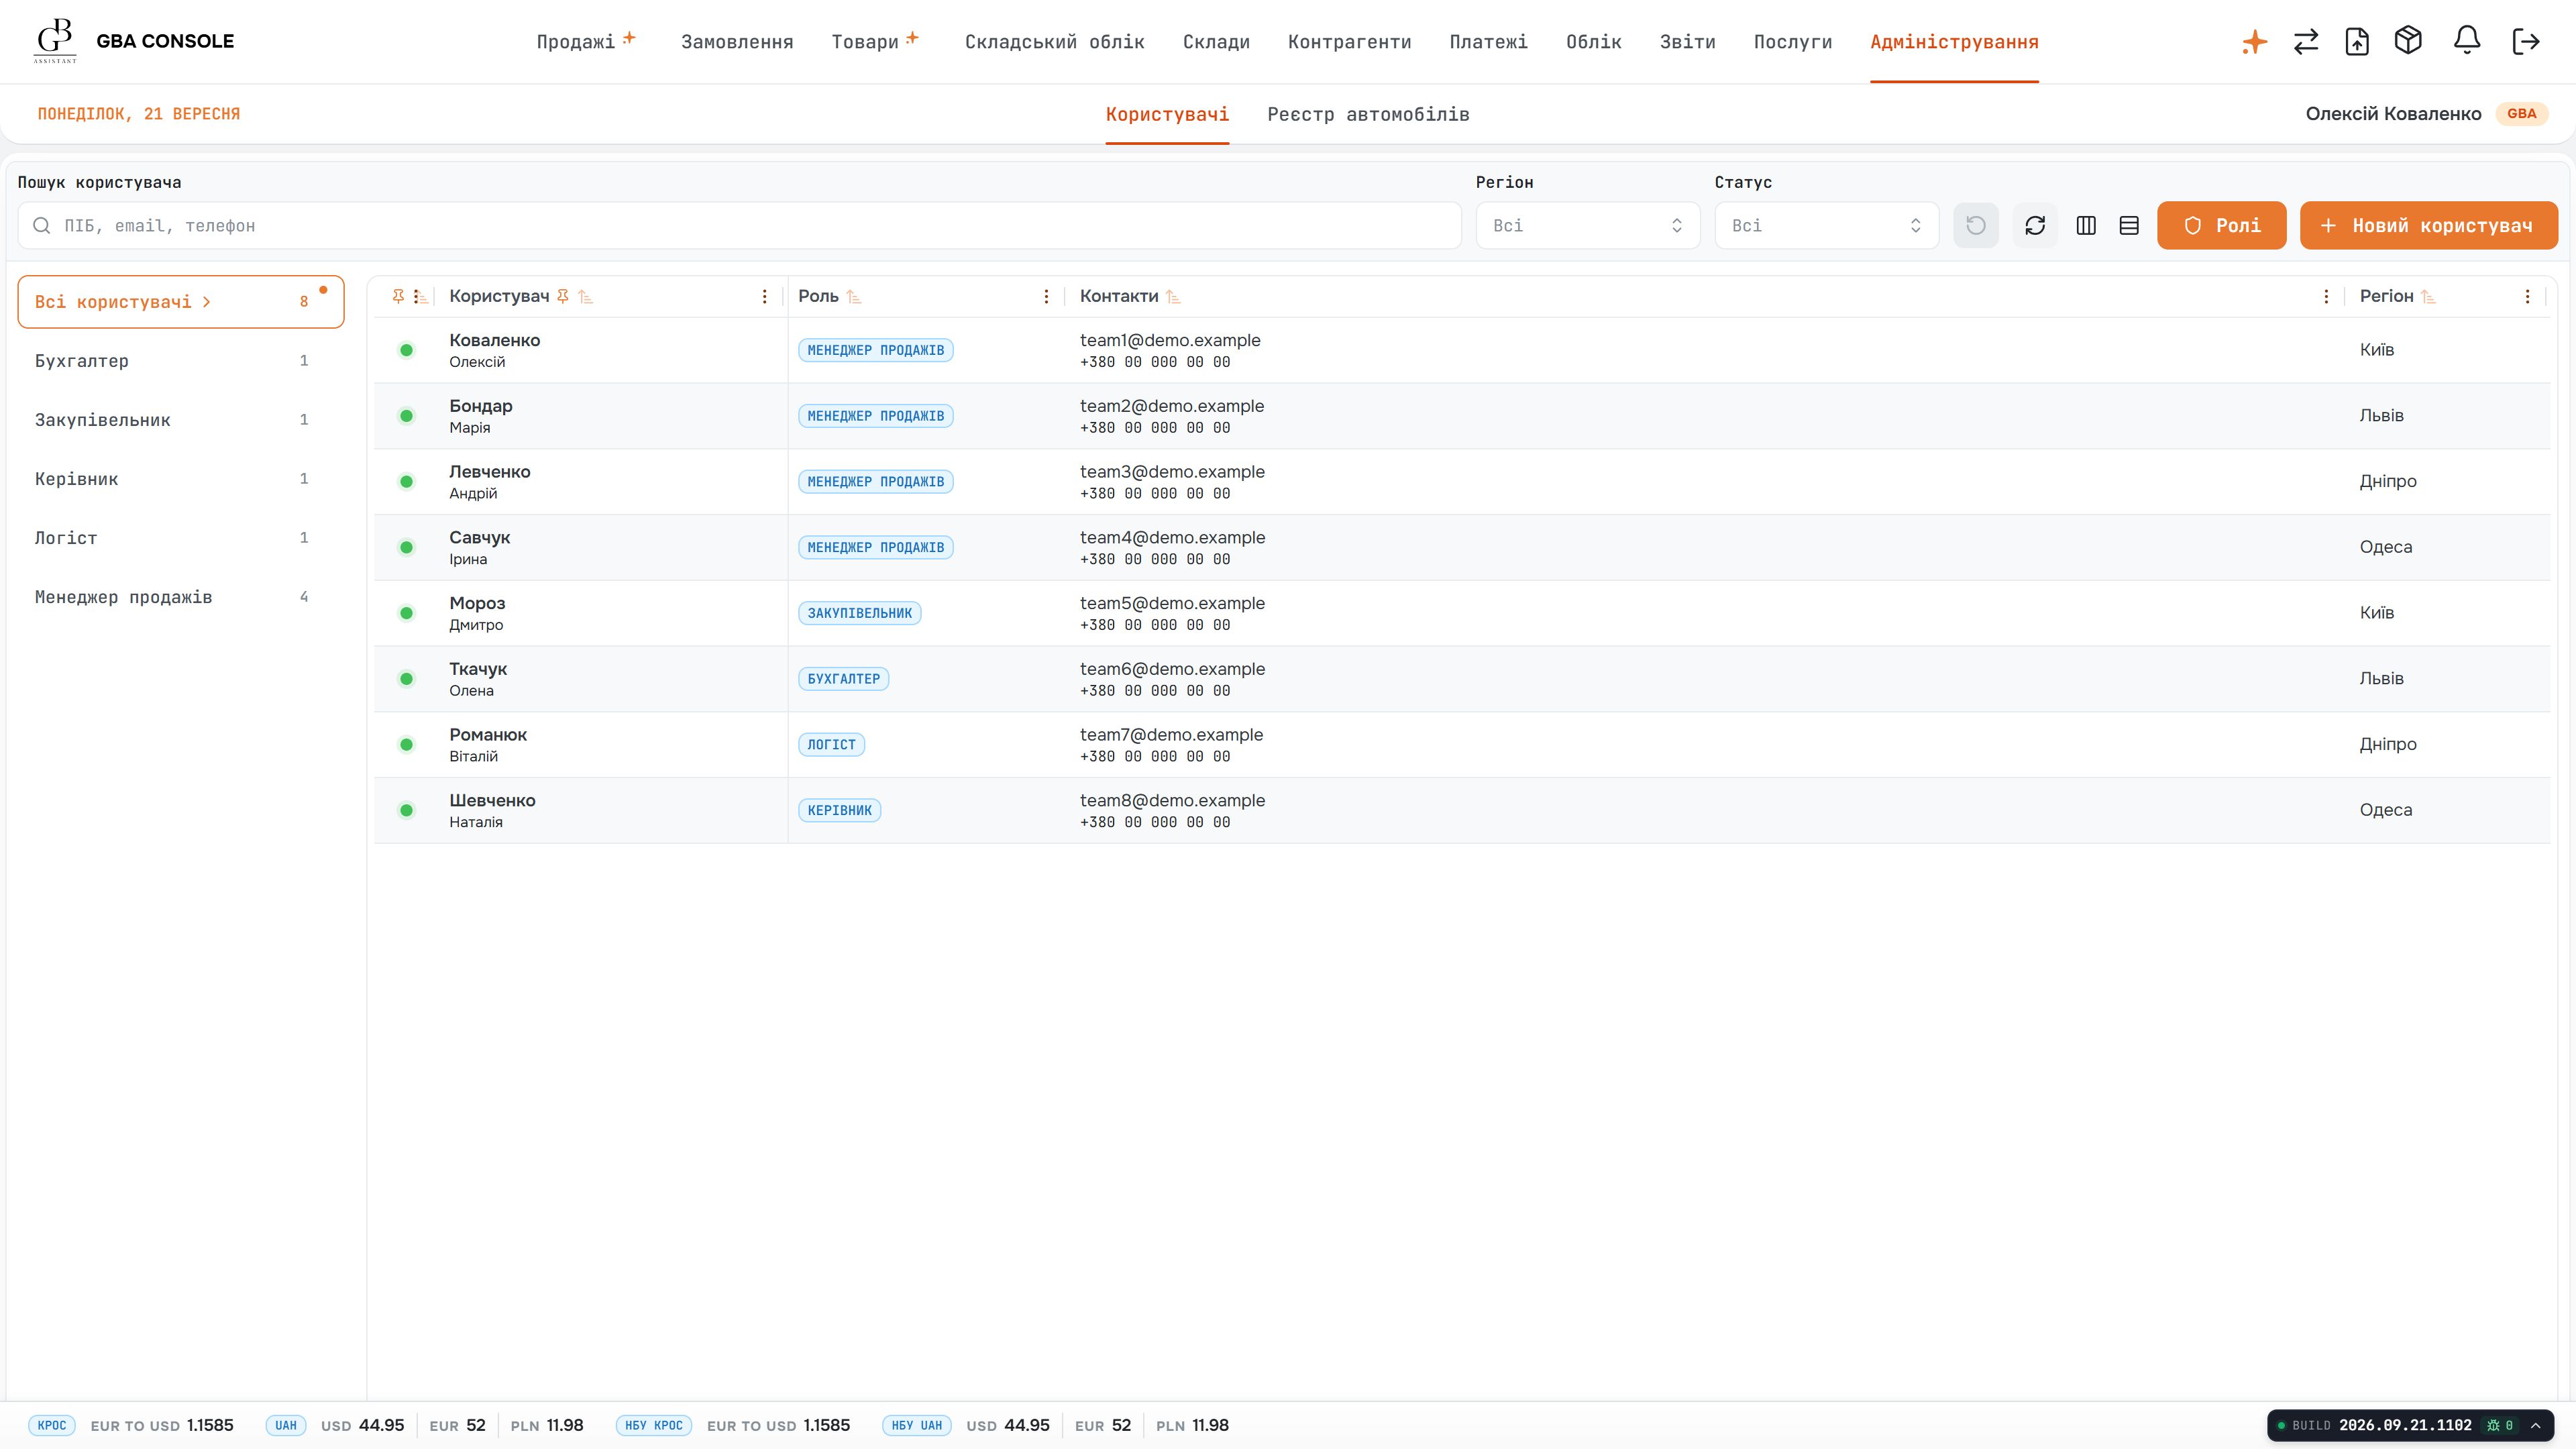
Team administration shows who has an account, their assigned role and current status. Contact and location details remain beside the account, giving administrators a practical overview of the people using the console.
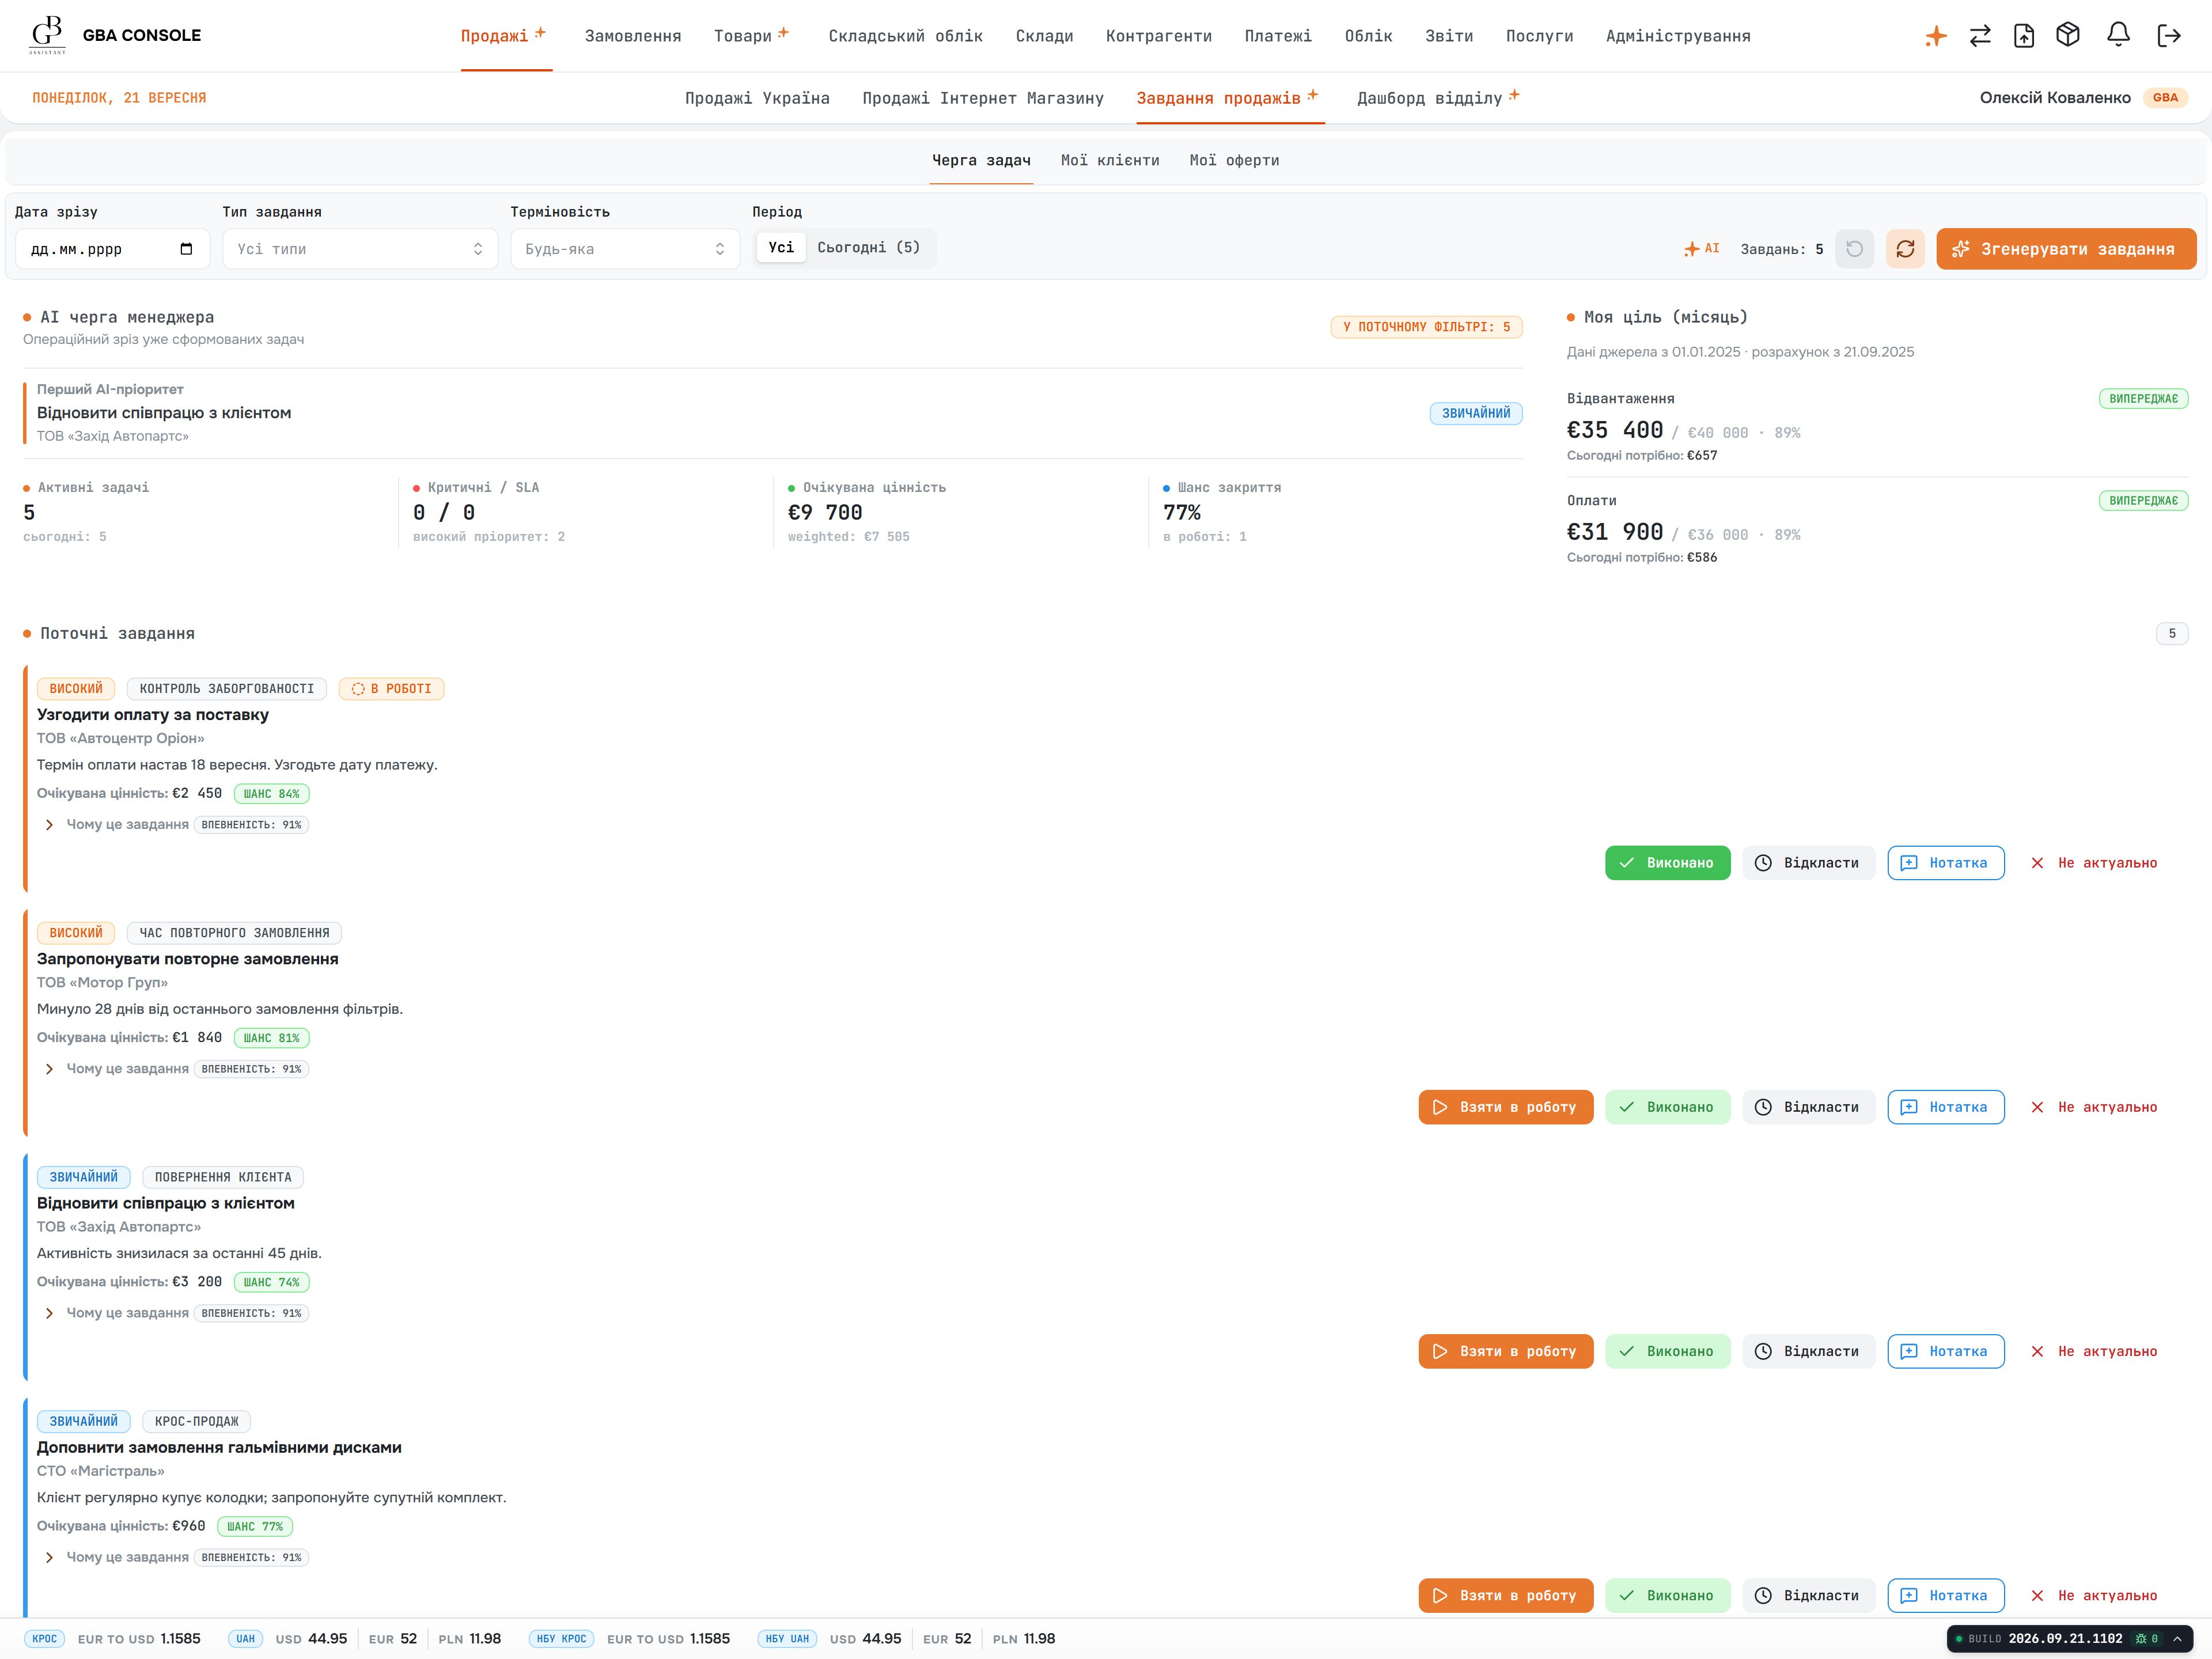
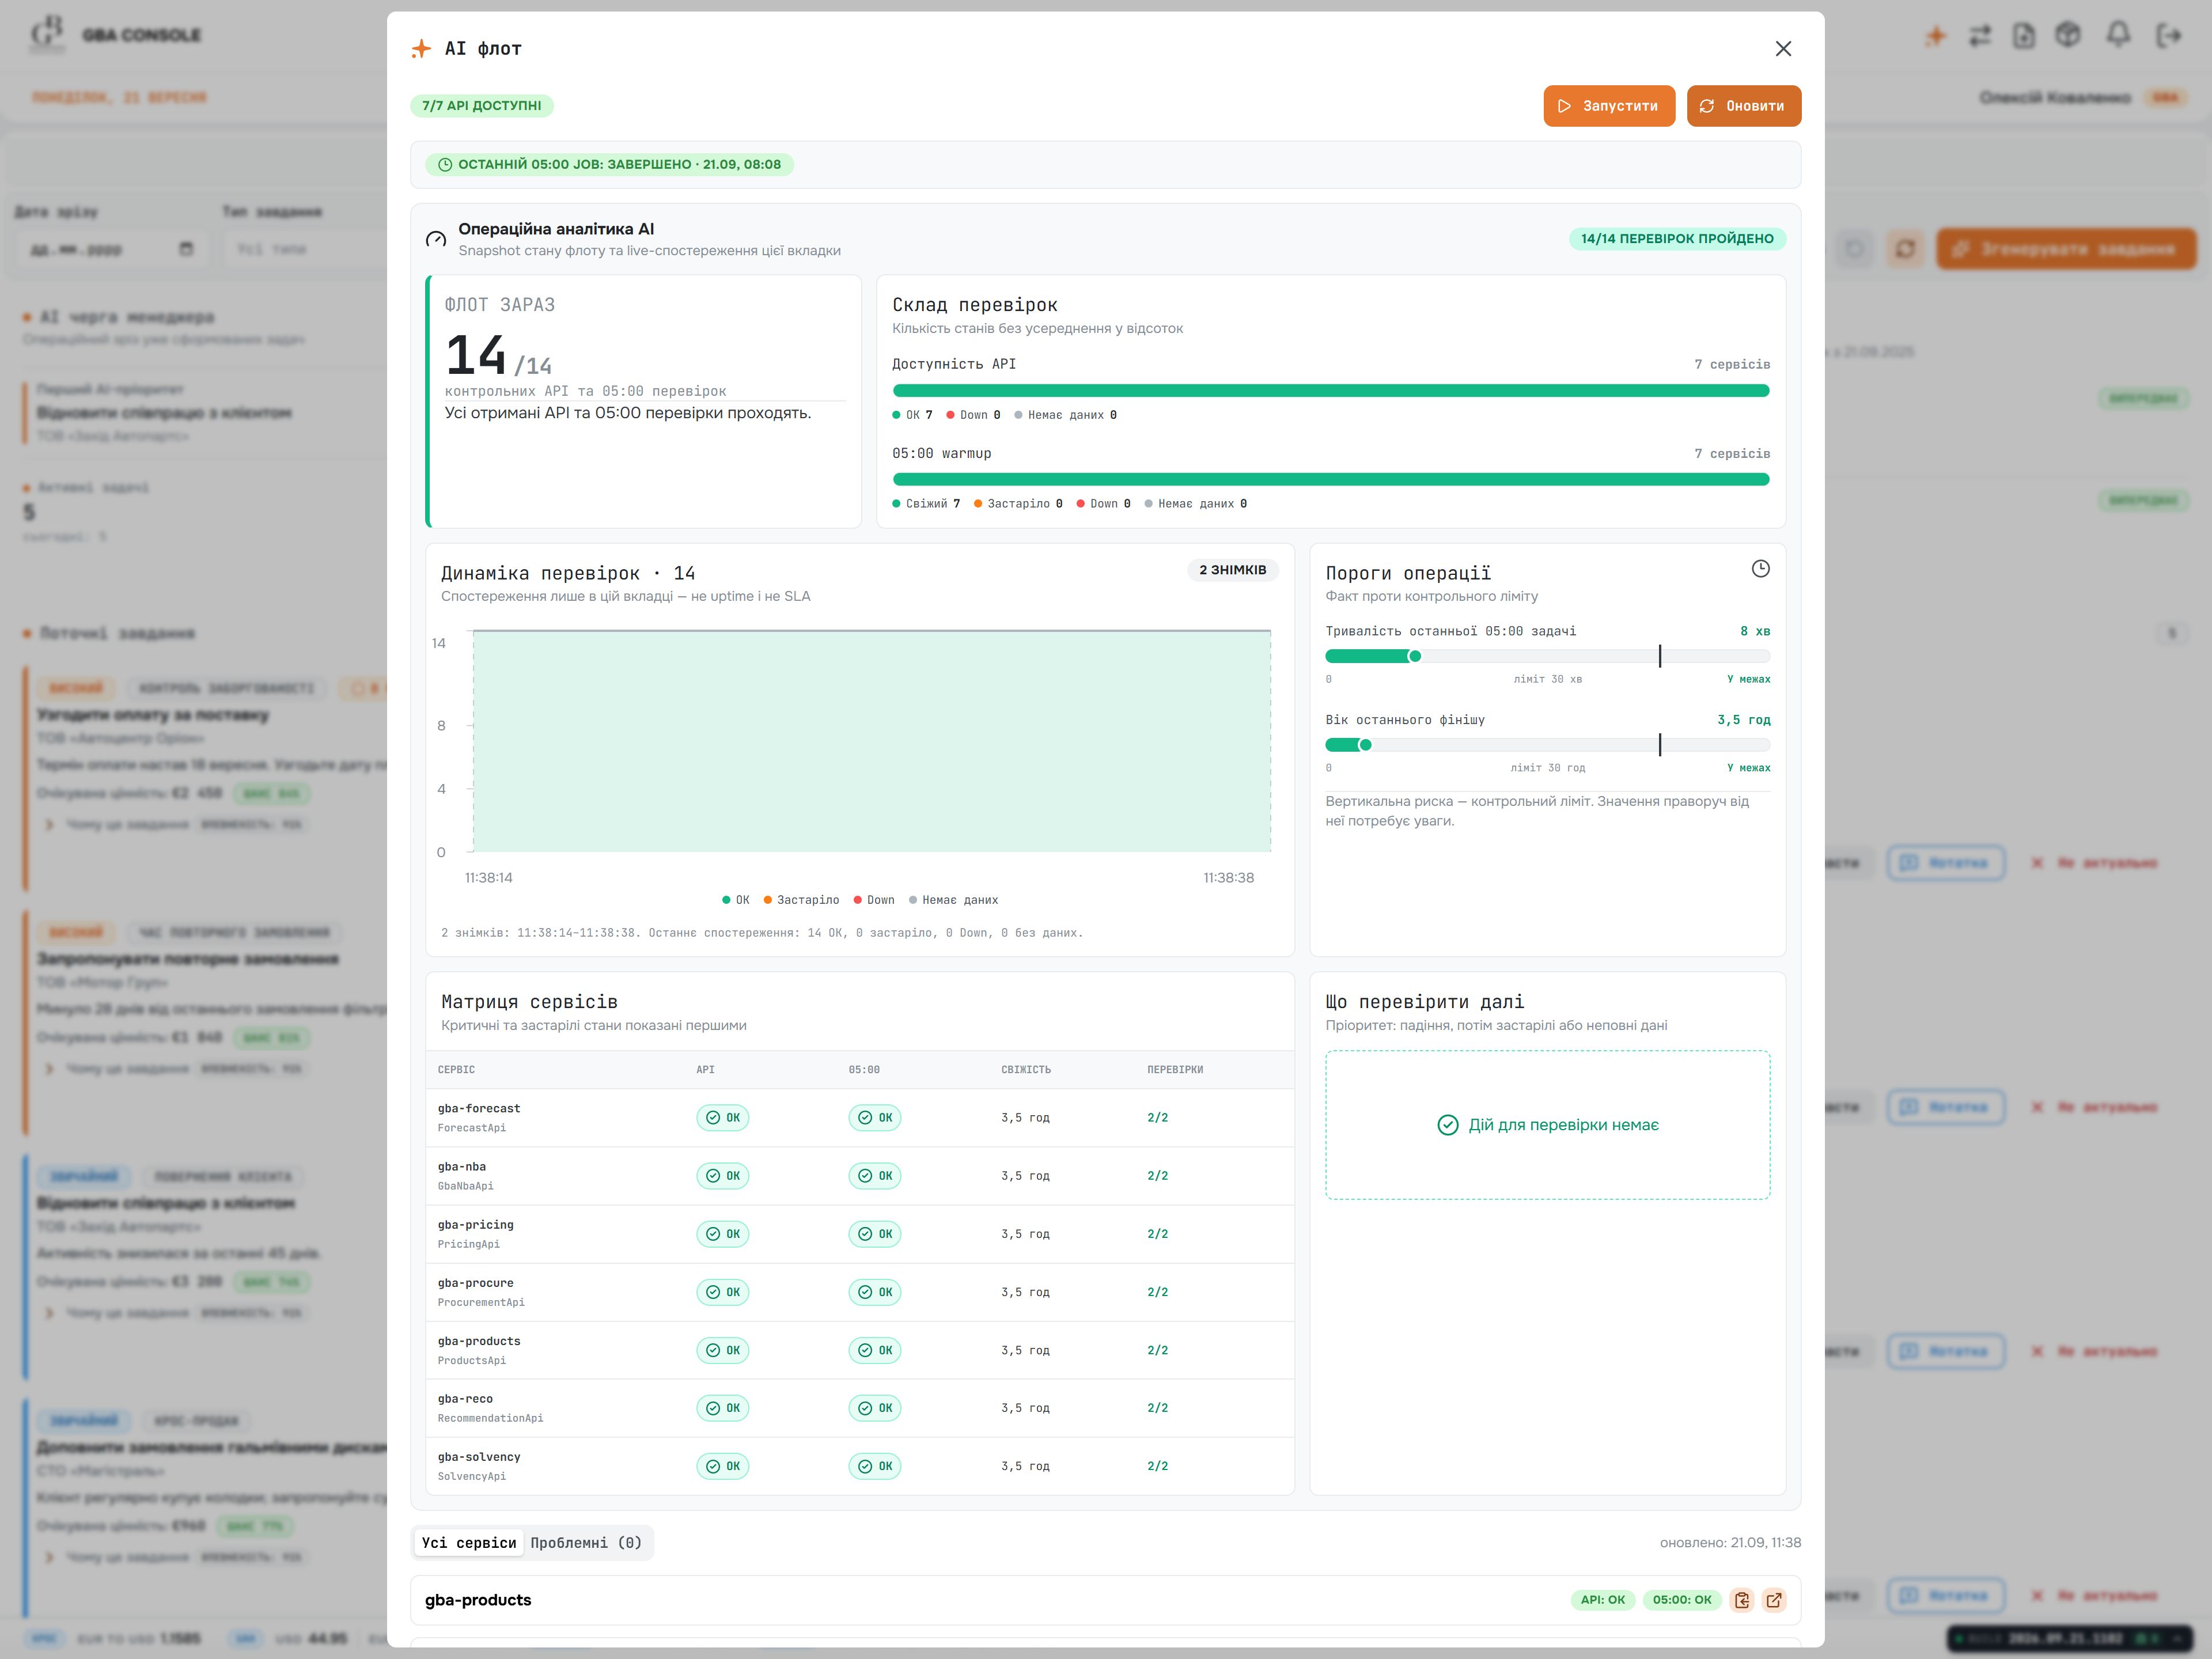
A suggestion is presented as a task with a customer context, explanation and priority. Action controls let the manager review the proposal where the team’s work is already organised.
A suggested action needs enough context for a manager to decide whether to act. The team also needs visibility into the service producing those suggestions, rather than treating every output as an unexplained instruction.
AI suggestions appear as tasks with customer context, explanations and priorities. A separate operations panel shows processing activity, service status and usage, keeping the business review distinct from the service’s operation.
Screens show demonstration data, not client records.
Choose a storage cell to see its item and quantities. A rack, level and position turn a stock figure into a place the team can find.
Example quantities. Select a cell to inspect its address.
See what has shipped, what has been paid and what each team needs to do next.
€10,000
100 units €100
60/ 100 units
€6,000
WarehouseDispatch the remaining 40 units.
FinanceReconcile the remaining €4,000.
Follow each department’s records and check the quantities and balances at every stage.
Choose a path or select an item to inspect its meaning. Scroll the canvas horizontally on smaller screens.
Start with a path above, then inspect a record. The explanation below the canvas connects each step to the business question it can answer.
Show us how this step works in your business.
Discuss this processThe worksheet keeps the quantities and amounts explicit. “Outstanding” means order value minus cumulative receipts.
| Checkpoint | Ordered | Dispatched | Still to dispatch | Receipts | Outstanding |
|---|---|---|---|---|---|
| Order agreed | 100 units | 0 units | 100 units | €4,000 | €6,000 |
| Partial dispatch | 100 units | 60 units | 40 units | €6,000 | €4,000 |
| Final review | 100 units | 100 units | 0 units | €10,000 | €0 |
At the middle checkpoint, the customer is waiting for 40 units and finance is reviewing €4,000. Those are two follow-up tasks with different evidence and potentially different owners.
Explore the documented product responsibilities and their connections. Each scenario highlights a different set of dependencies; select a component to inspect its role.
Select a component to explore its connections. On a small screen, scroll the map horizontally.
Choose a workflow or component above to see its records and connections.
Have a similar workflow to connect?
Discuss this workflowThe GBA stack connects a web workspace, .NET application services, SQL Server business records and Python AI services.
Explore security & performanceReact and Next.js power the web workspace for sales, warehouse and finance teams. TypeScript defines the interface code; Redux manages shared application state.
ASP.NET Core and C# implement the APIs and business rules around orders, goods and financial records. Akka.NET supports actor-based processing within the application services.
SQL Server holds the relational business data. Entity Framework Core maps application entities to that data; Dapper supports direct SQL queries from the .NET services.
Elasticsearch indexes application data for search; Redis caches frequently requested values for the services.
SignalR provides communication between the .NET services and the web interface, supporting server-pushed updates while people work in the application.
Document-generation and spreadsheet libraries turn operational records into PDF documents and Excel exports for reporting, exchange and further analysis.
Python powers the AI services. Suggested actions appear in the team’s task queue, where people review them alongside the relevant customer and operational records.
IIS hosts the ASP.NET Core application on Windows. Docker is part of the service packaging stack, with Azure services and Azure DevOps in the infrastructure and delivery toolchain.
For an IIS and SQL Server deployment, we agree the protection measures, load checks and recovery procedures with the infrastructure team. The areas below describe this planning approach; the controls and owners are defined for each environment.
We define the IIS hosting configuration, service identity and permitted resources for each application.
We map HTTPS endpoints and service connections, then agree certificate validation, renewal and the responsible owner.
We agree encryption and application permissions alongside recovery requirements for documents, exports and database backups.
We use query history and execution plans to locate the delay before changing SQL, indexes or server capacity.
We review repeated database calls and cache behaviour for the selected workflow, from an individual request to concurrent use.
We agree alert conditions, response ownership and the steps to verify recovery before the system returns to service.
We compare each change against the same working scenario, so the result can be checked.
Choose a working scenario, such as opening the order register. Record response time, errors and resource use under a defined load.
Trace the delay to its cause, then adjust the query, index, cache or server setting. Record the change and how to reverse it.
Repeat the same scenario under comparable load. Compare timings and resource use, and check that records and calculations remain correct.
If the checks confirm the improvement, we keep the change and monitor it in use. If not, we revert it and investigate the next cause.
A related portfolio case follows parts discovery, product selection and guided checkout.
Explore the related workWe help turn your current workflow into a practical development plan, then handle the agreed design, engineering, testing and launch work with your team.
Choose one recurring reconciliation problem: a purchase, warehouse transfer or customer balance. We map the records and owners, build the agreed journey and review it with the people who will use it.
We assess their APIs and data ownership first. The scope then defines which system owns each record, how updates are synchronised and how staff resolve duplicates or discrepancies.
Your finance and domain specialists confirm the rules using representative trades. We turn those decisions into calculations, documents and review screens, then test the examples together.
Bring one order that required a call between sales, warehouse and finance. We can map the records each team needed, where their answers diverged and which connected workflow would make a useful first release.
Map your order workflow Explore the development service