
Reporting workspace
React 18, TypeScript and Material UI form the reporting and administration interface.
Production figures with a shared reporting structure.
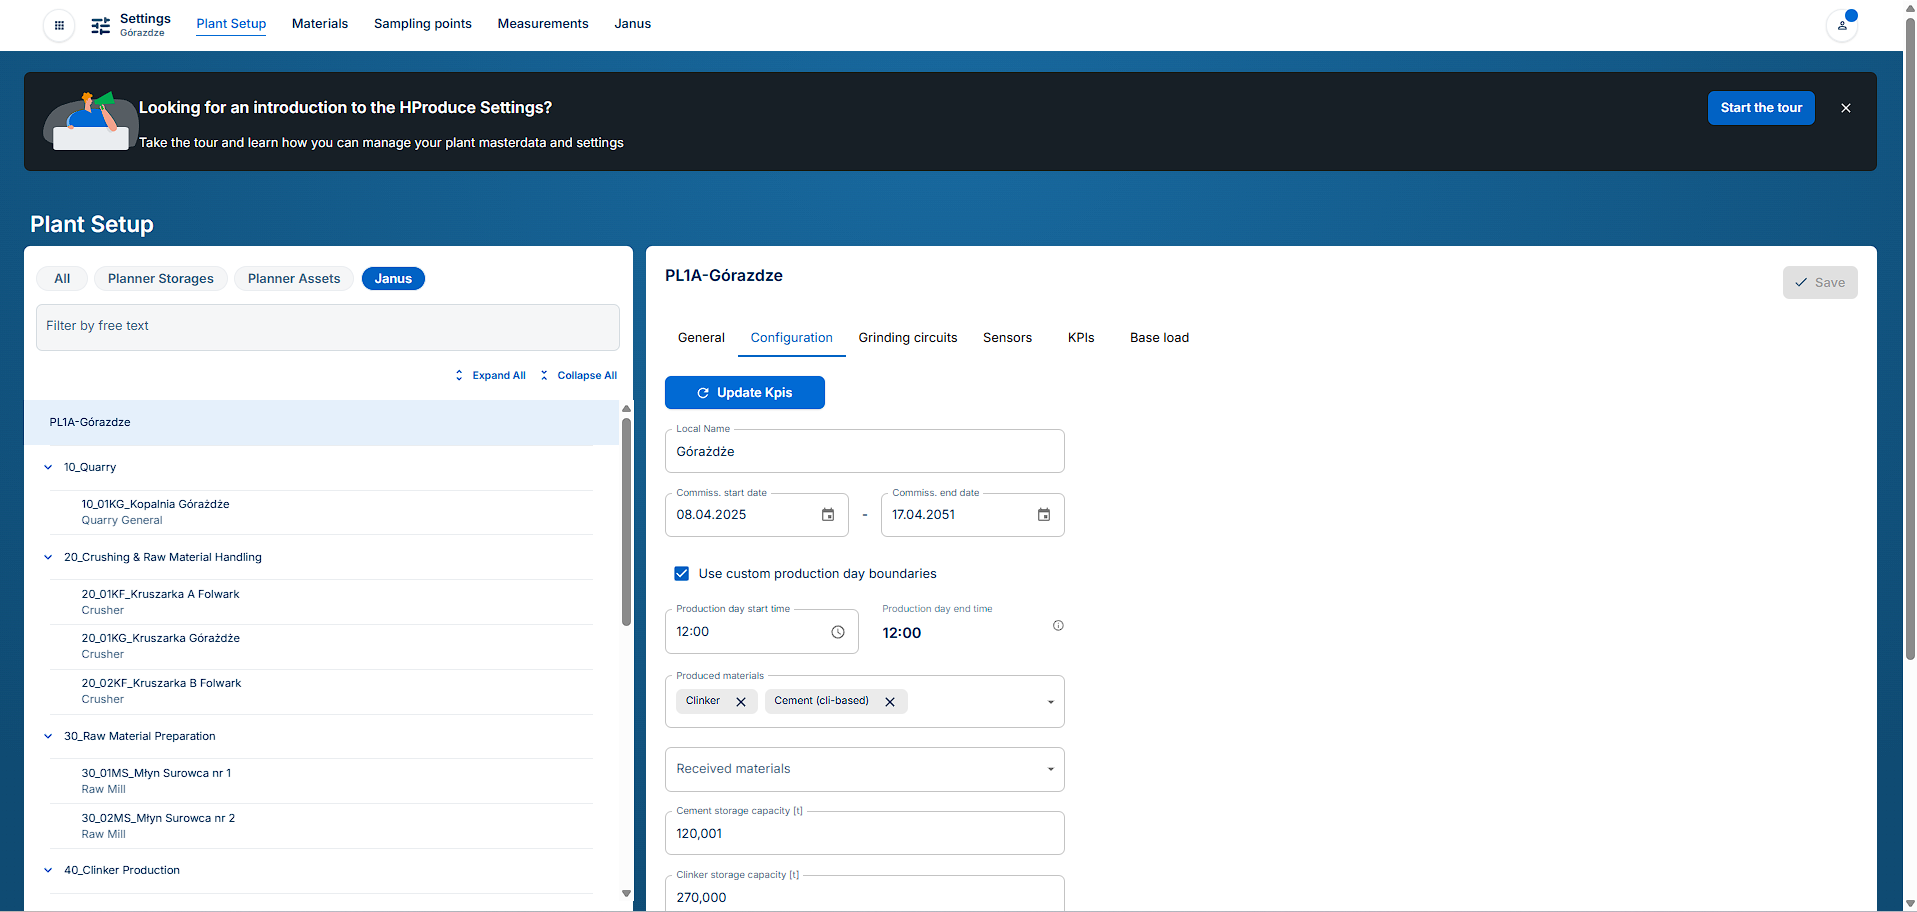
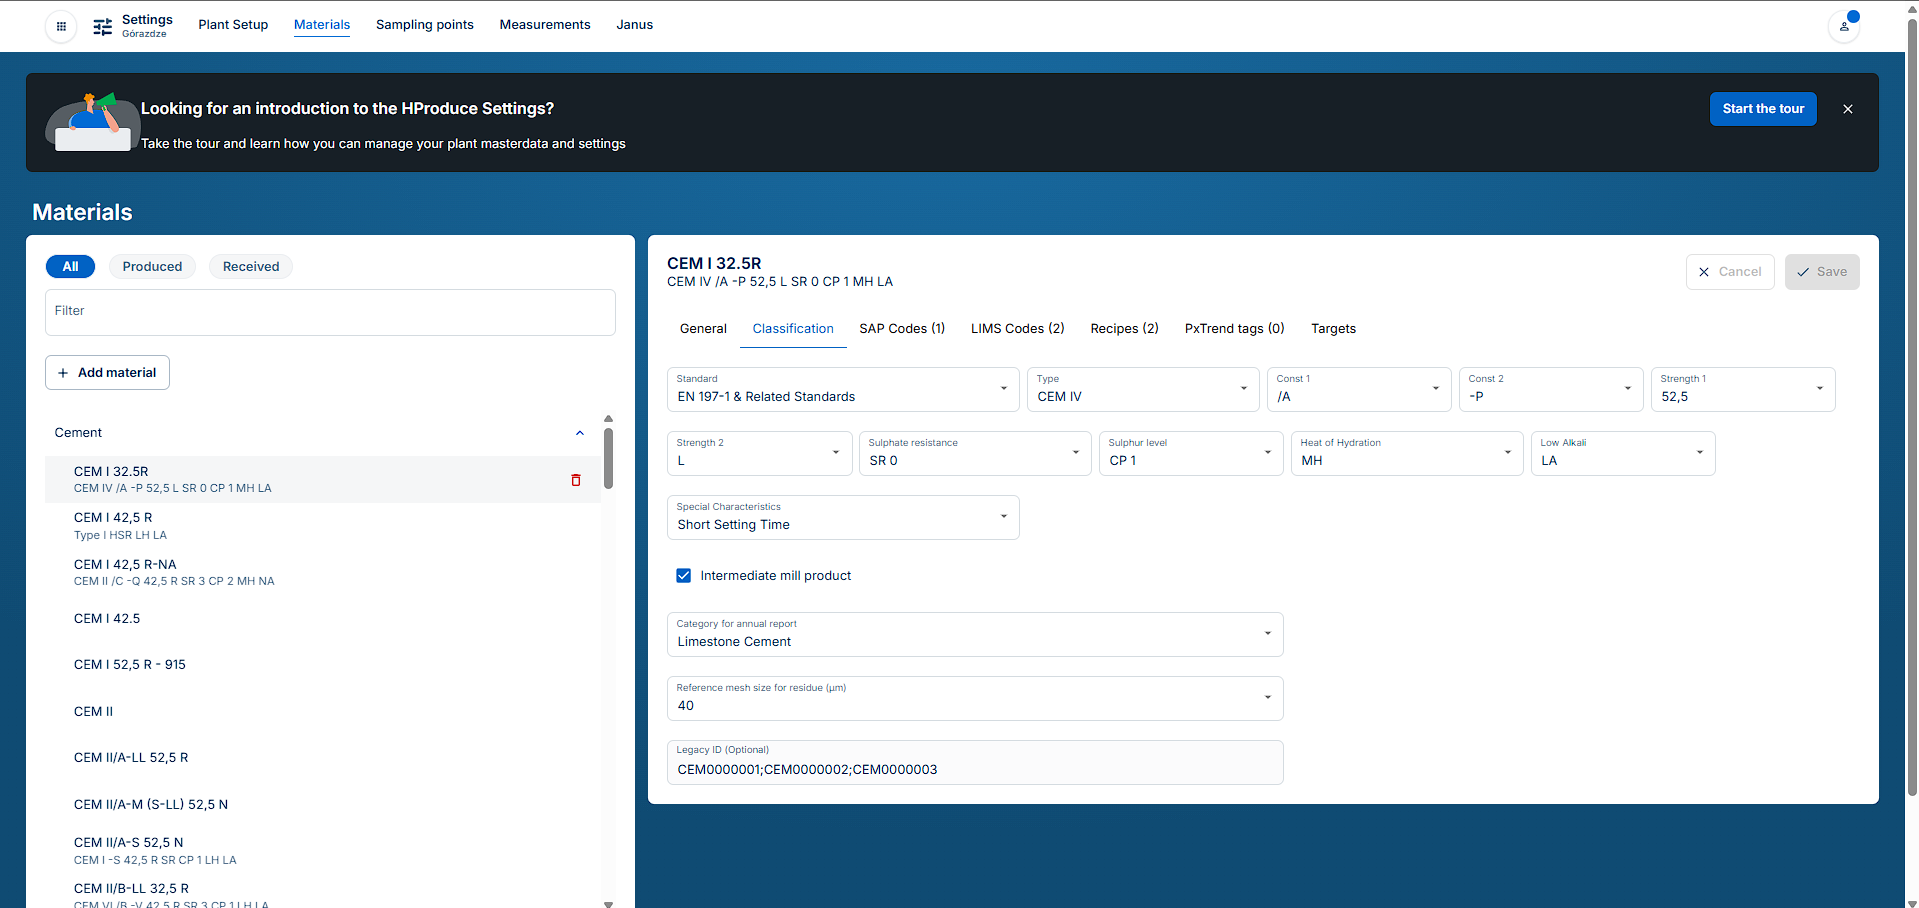
Janus connects daily production inputs, KPI calculations and reporting across plants. Local teams record the figures, while administrators maintain the equipment and material structure, configure operating rules and manage reporting periods. Historical comparisons and forecasts extend the same platform’s analytical capabilities.
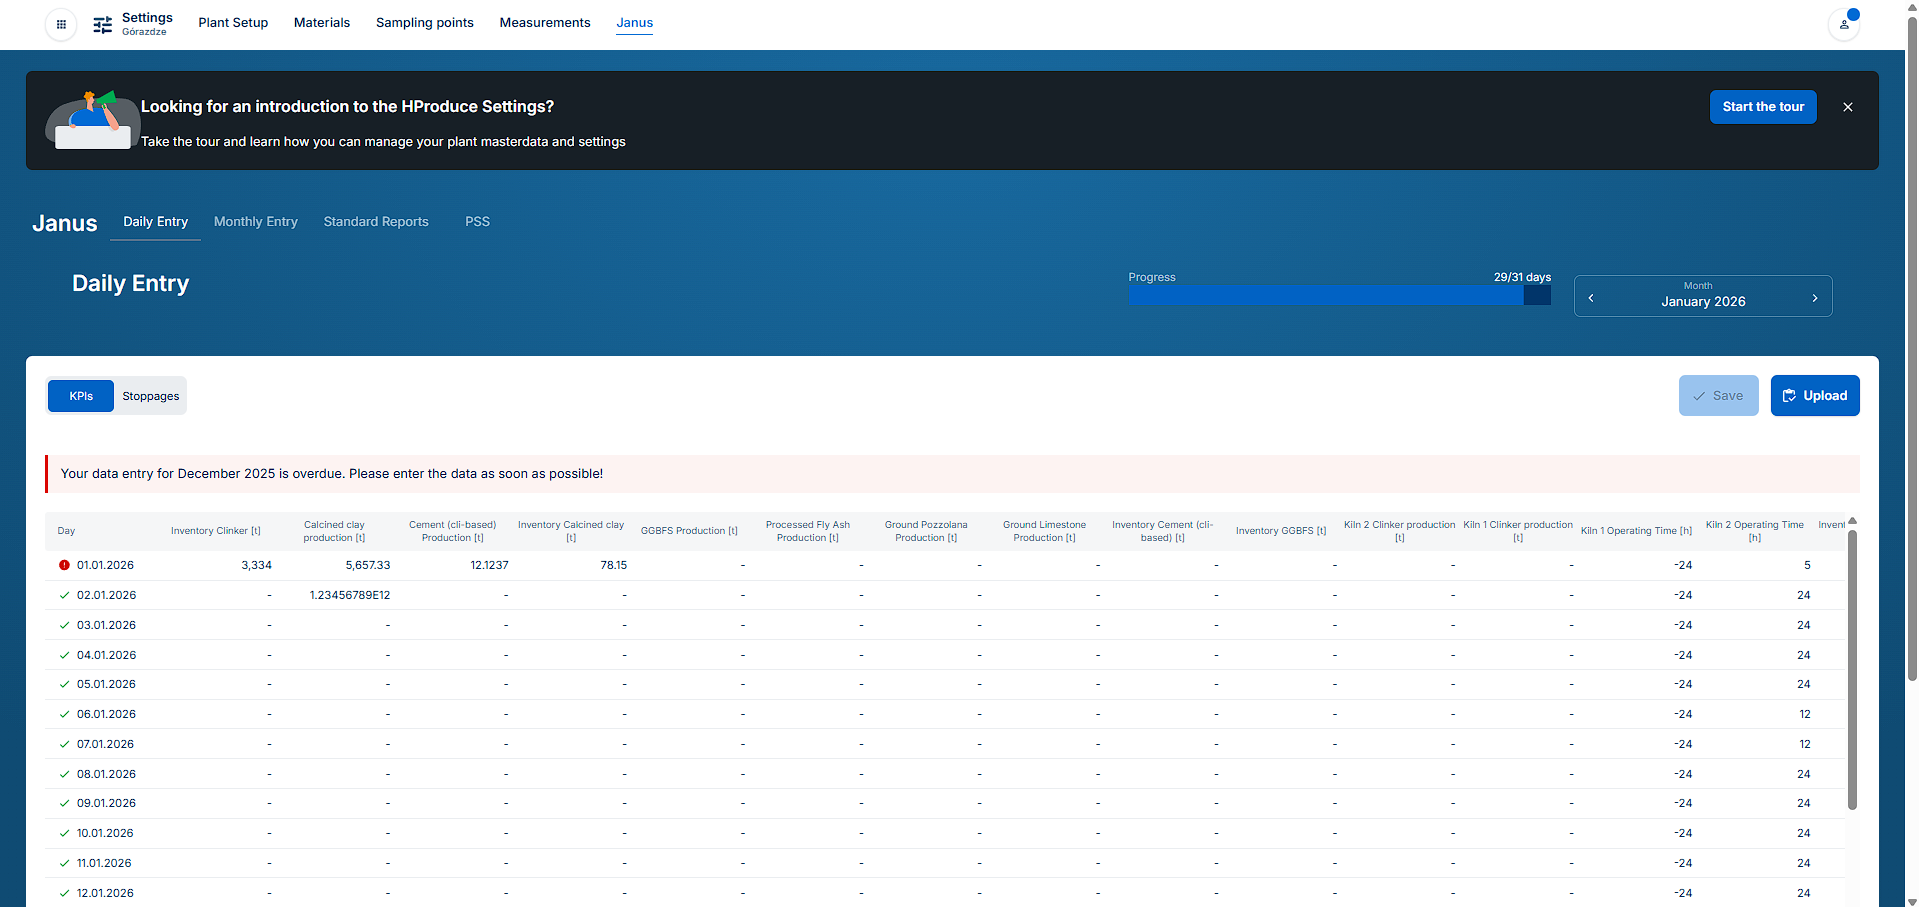
Daily rows separate production and inventory quantities from operating hours, with units shown in each column. KPI and stoppage tabs share a month selector, completion indicator and overdue-entry notice, so the team can review reporting gaps before preparing the monthly figures.
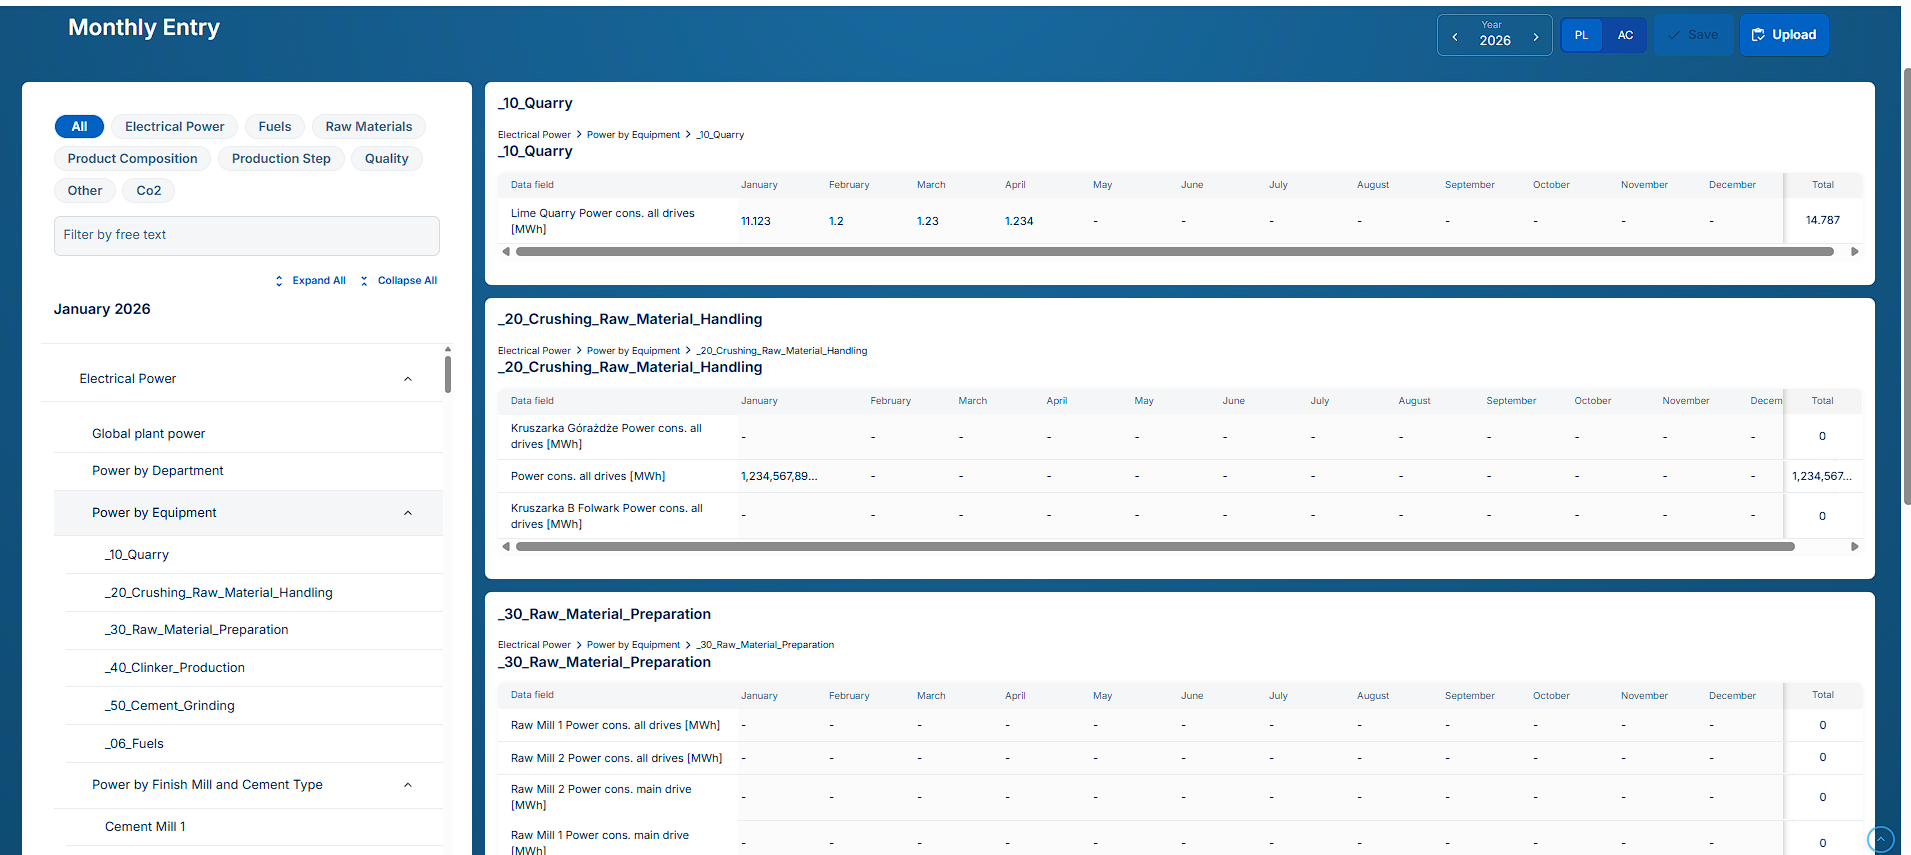
A monthly total needs a clear source within the plant. Teams need to know which department, equipment and measurement category a figure belongs to before interpreting it.
Category filters and the plant hierarchy organise electrical power, fuels, raw materials, production and quality data. Monthly columns and totals remain beside the selected equipment and measurement.
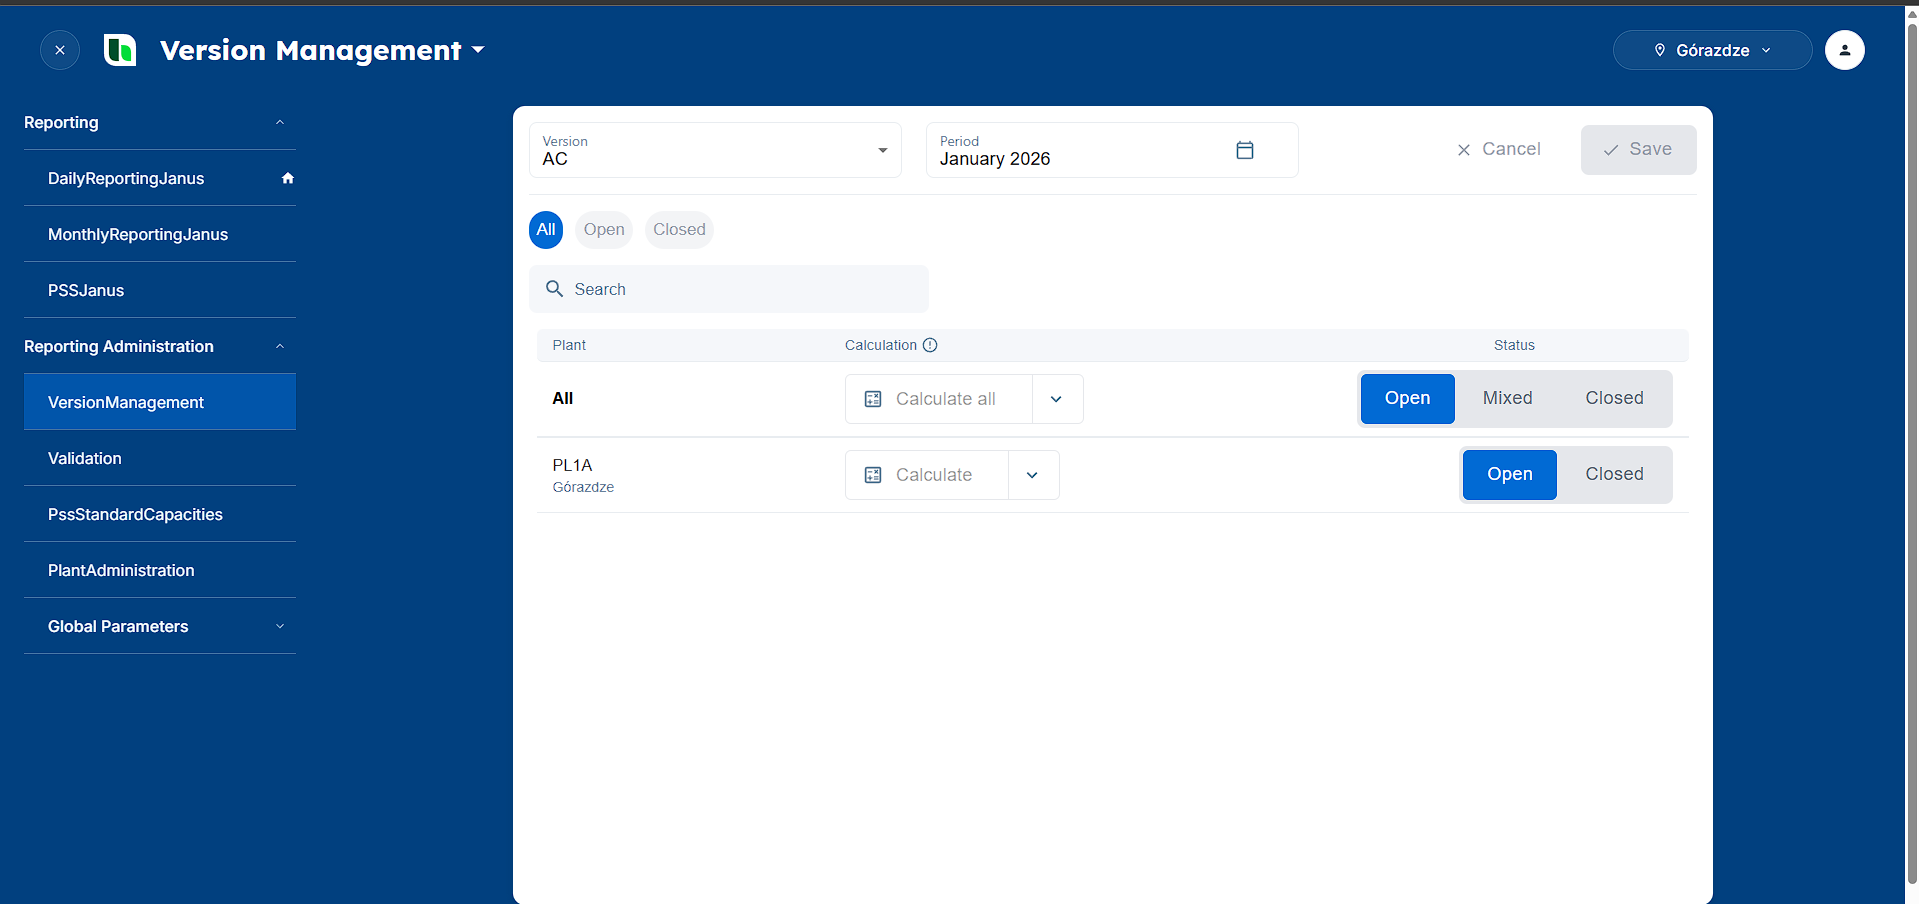
Reporting administration needs to distinguish the selected version and period from each plant’s current status. A shared overview helps the team see where reporting remains open and where it is closed.
Administrators select a version and period, then review open and closed plants. Calculation controls are available for an individual site or all sites, with an overview that also identifies mixed reporting status.
Plant reporting interfaces, calculation services and the infrastructure used to deliver them.
React 18, TypeScript and Material UI form the reporting and administration interface.
The service stack combines .NET 8 and ASP.NET Core with gRPC, Kafka and RabbitMQ.
EF Core provides data access; SQL Server and PostgreSQL are the project’s relational databases.
Docker and Kubernetes support deployment. Jest and Cypress are used for automated tests.
Bring a daily report and the monthly summary it feeds. We will map the input, unit, reporting period and calculation rules before designing the shared workspace.
Plan your reporting platform